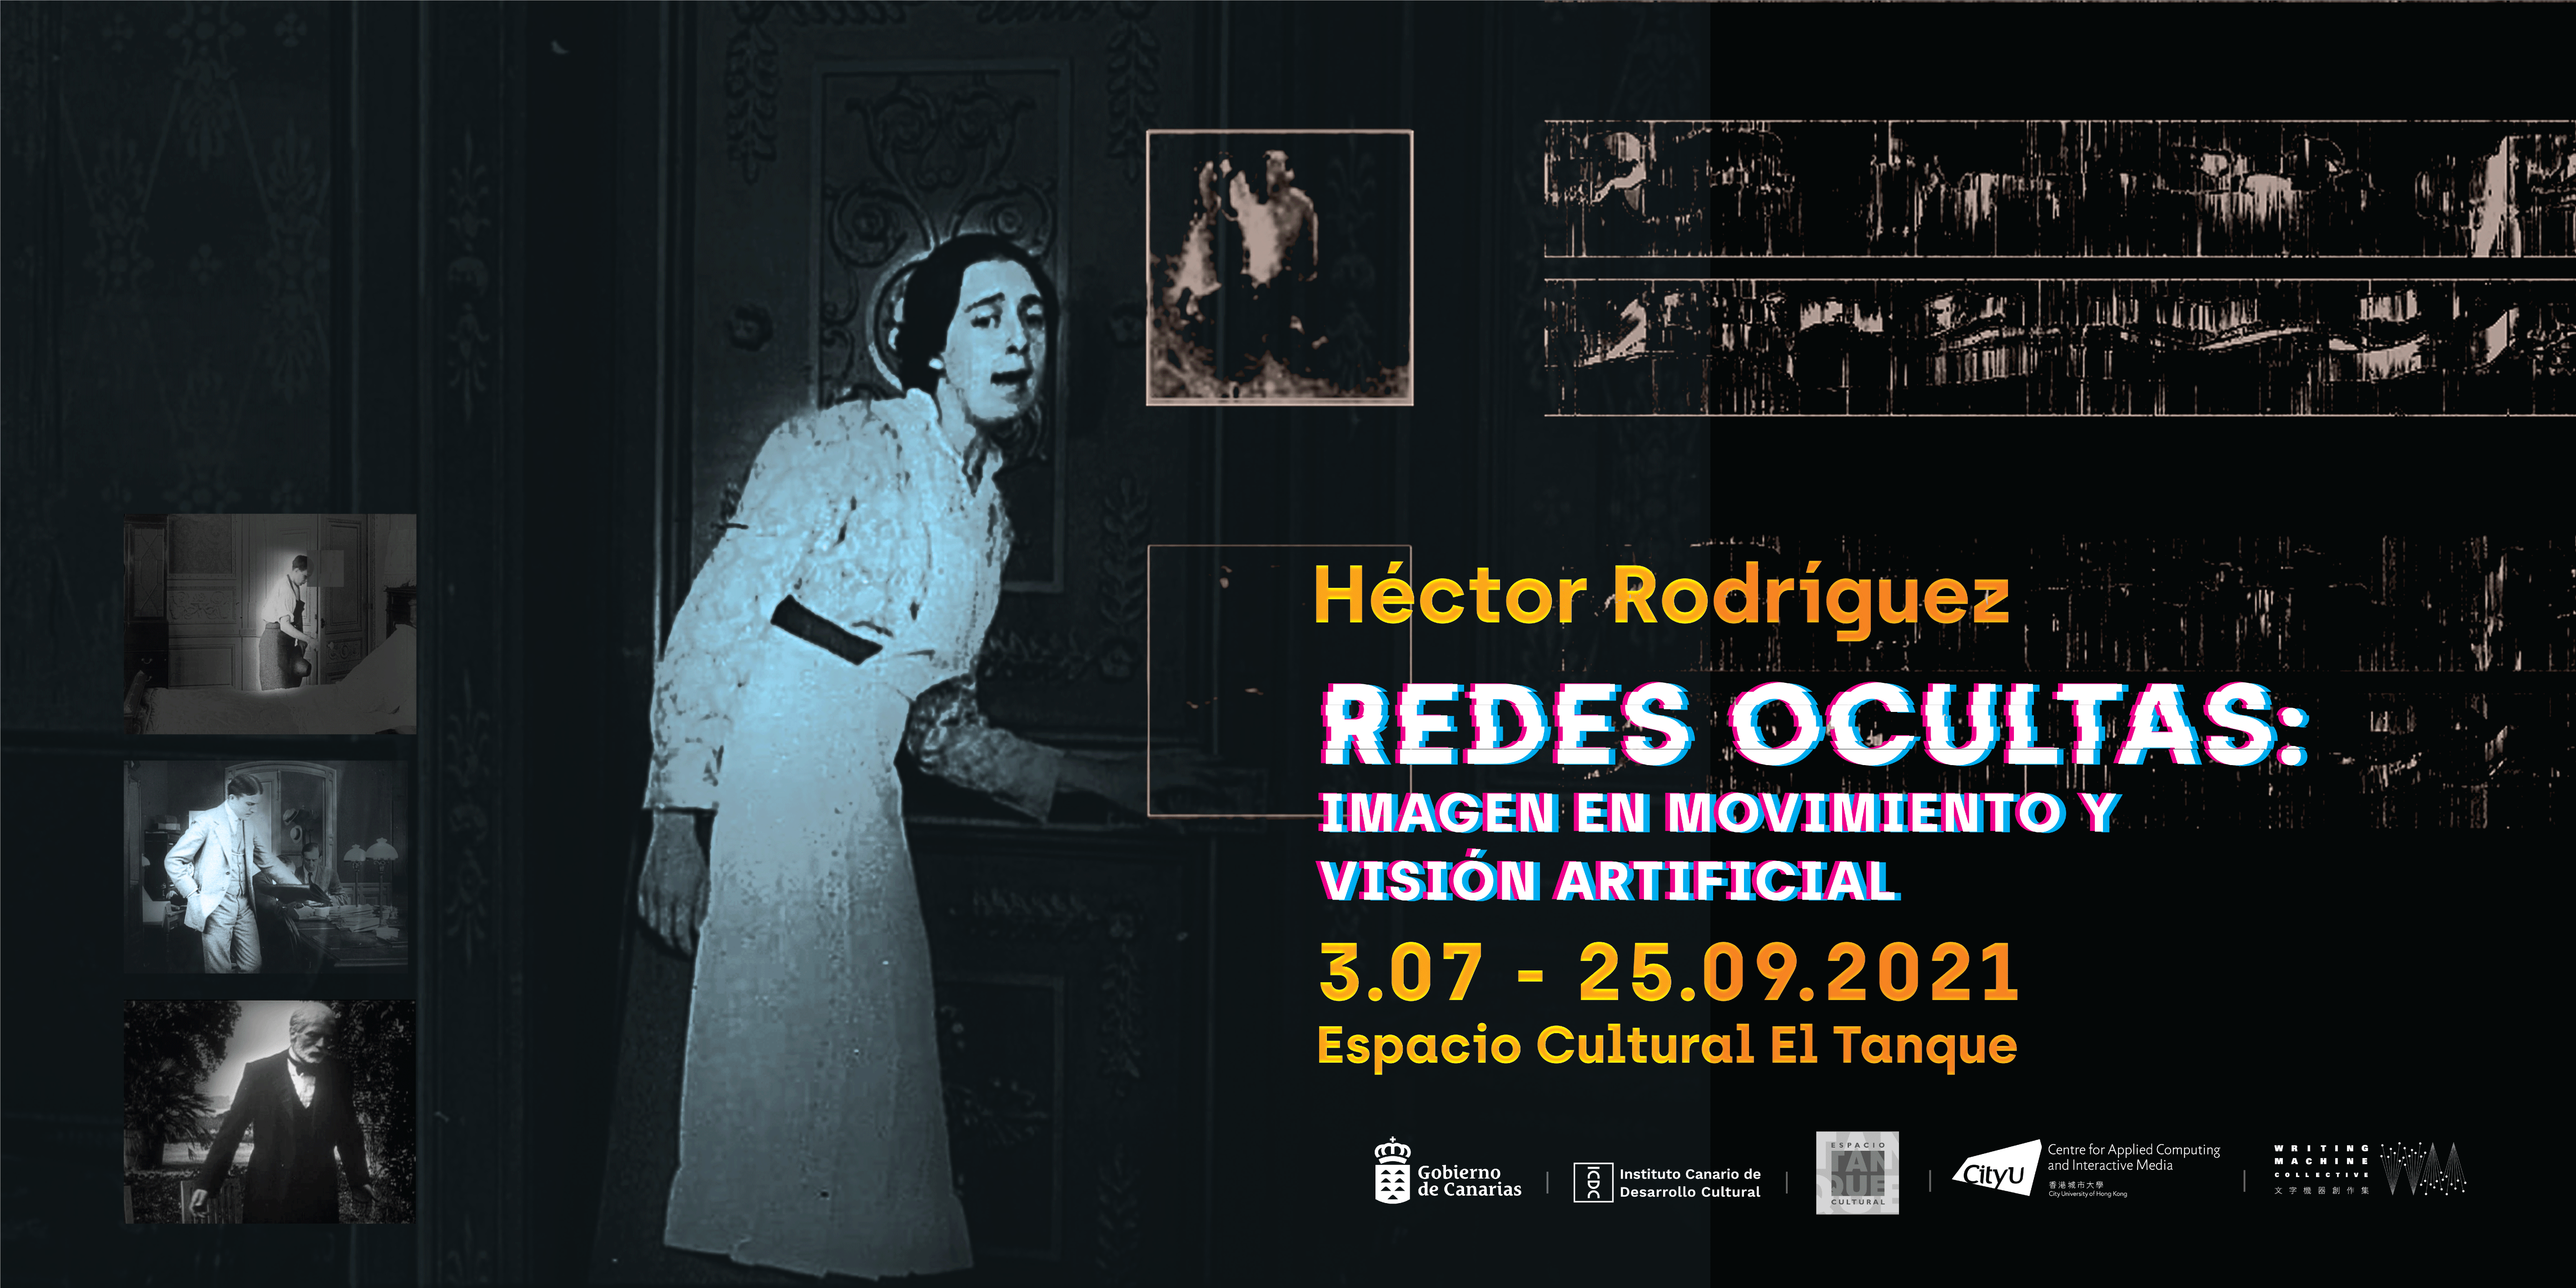
Hidden Networks is a large-scale multi-channel video installation that applies machine learning techniques to the analysis of the moving image. A system of deep neural networks analyzes the optical flow in a film dataset and identifies scenes with similar motions.
The dataset consists of two silent French film series, Les Vampires (1915) and Judex (1916), both directed by Louis Feuillade, a master of deep staging and visual choreography. A prominent example of Feuillade's orchestration of cinematic space and motion is the first sequence of Les Vampires, which is the central focus of this installation.
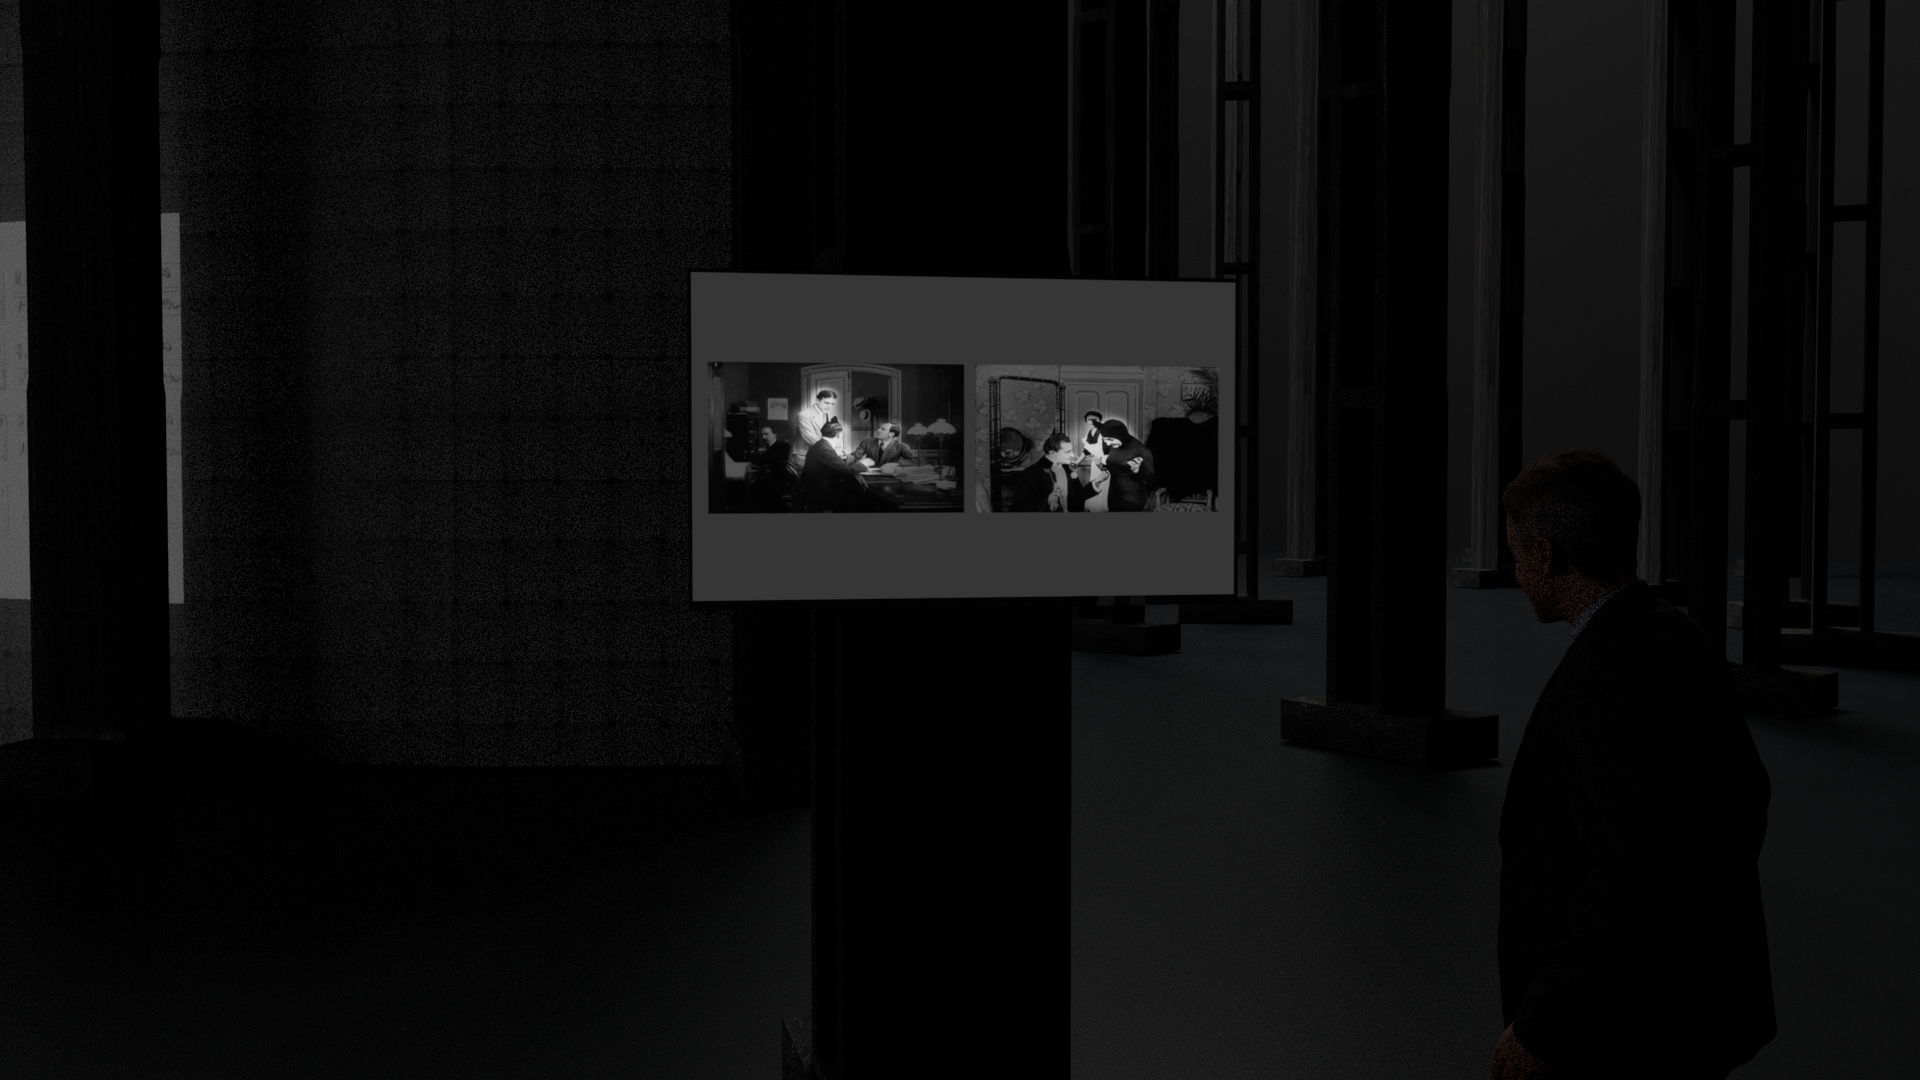
The system automatically selects other scenes from Feuillade’s work whose motion approximately matches that of the central sequence: the figures move in the same direction, with the same speed, or with the same rhythm. The following demo video shows the central sequence and one of the matching scenes chosen by the system.
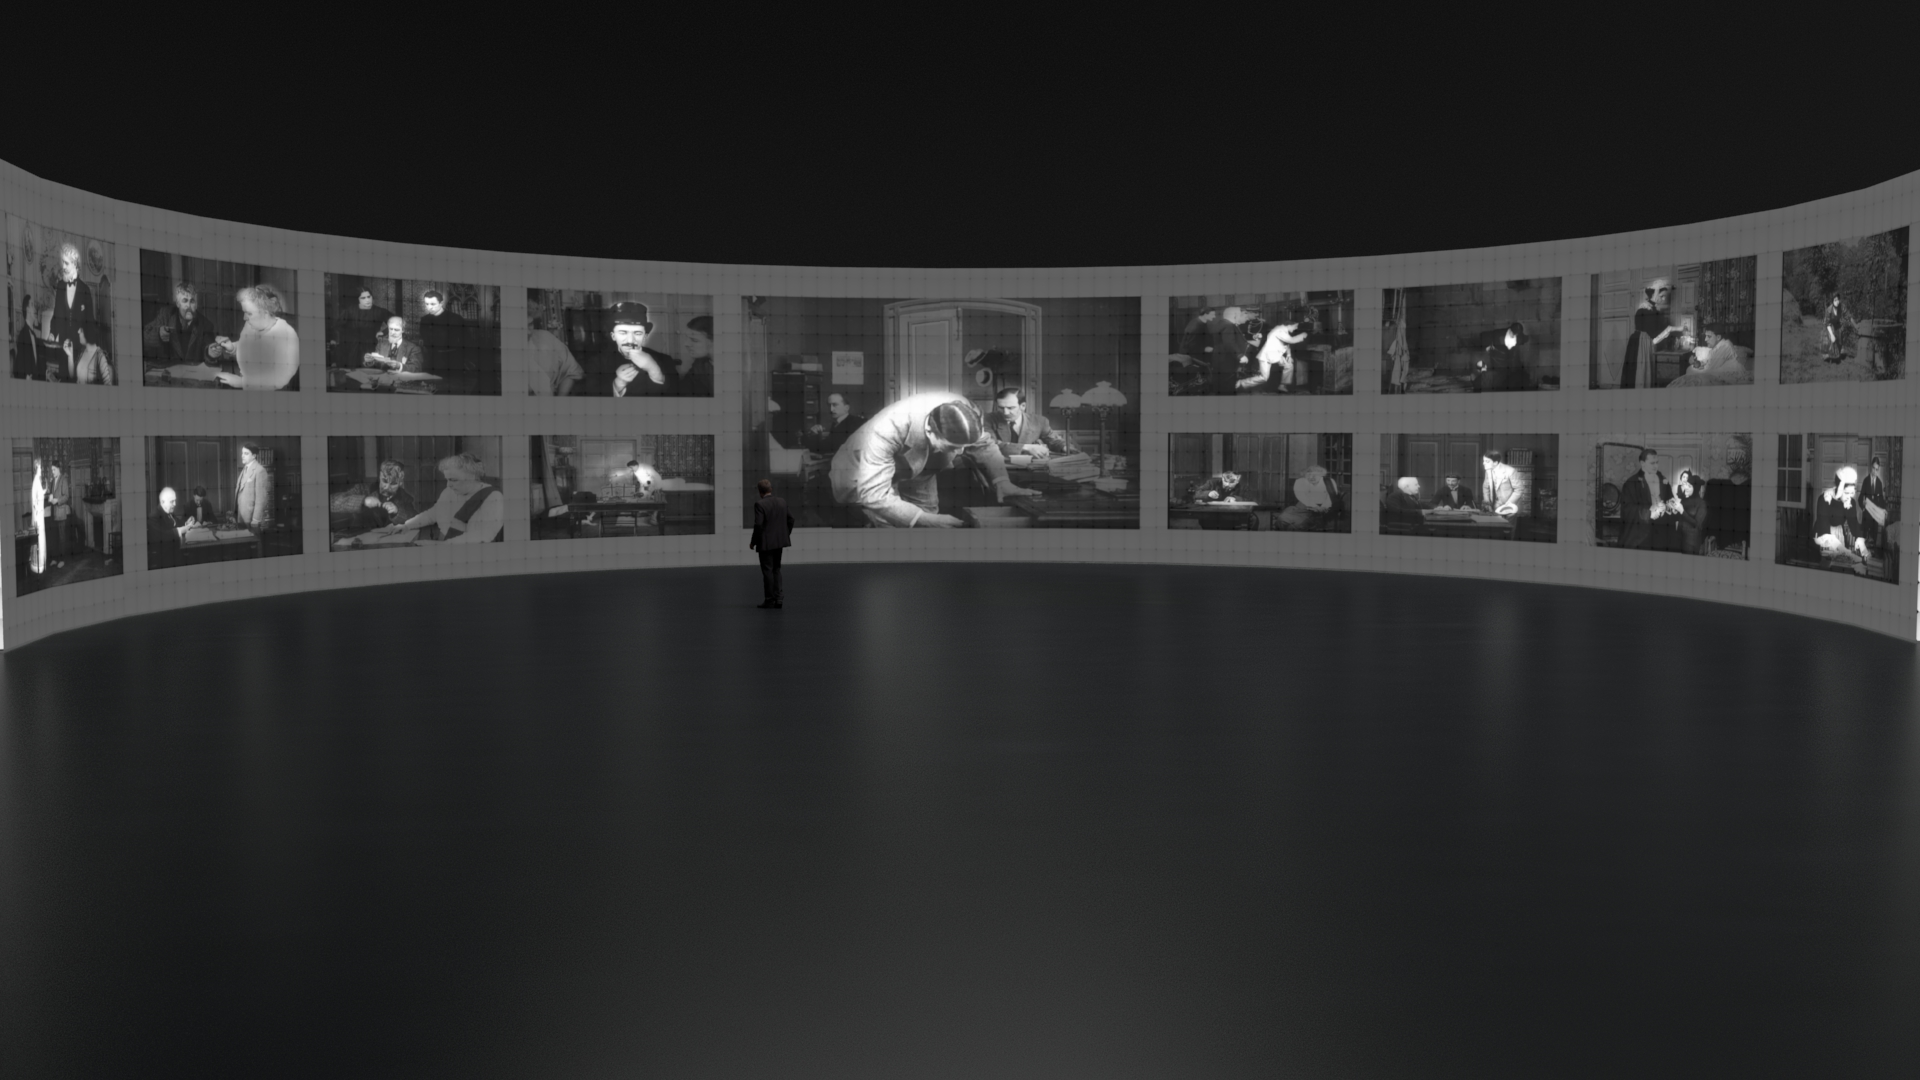
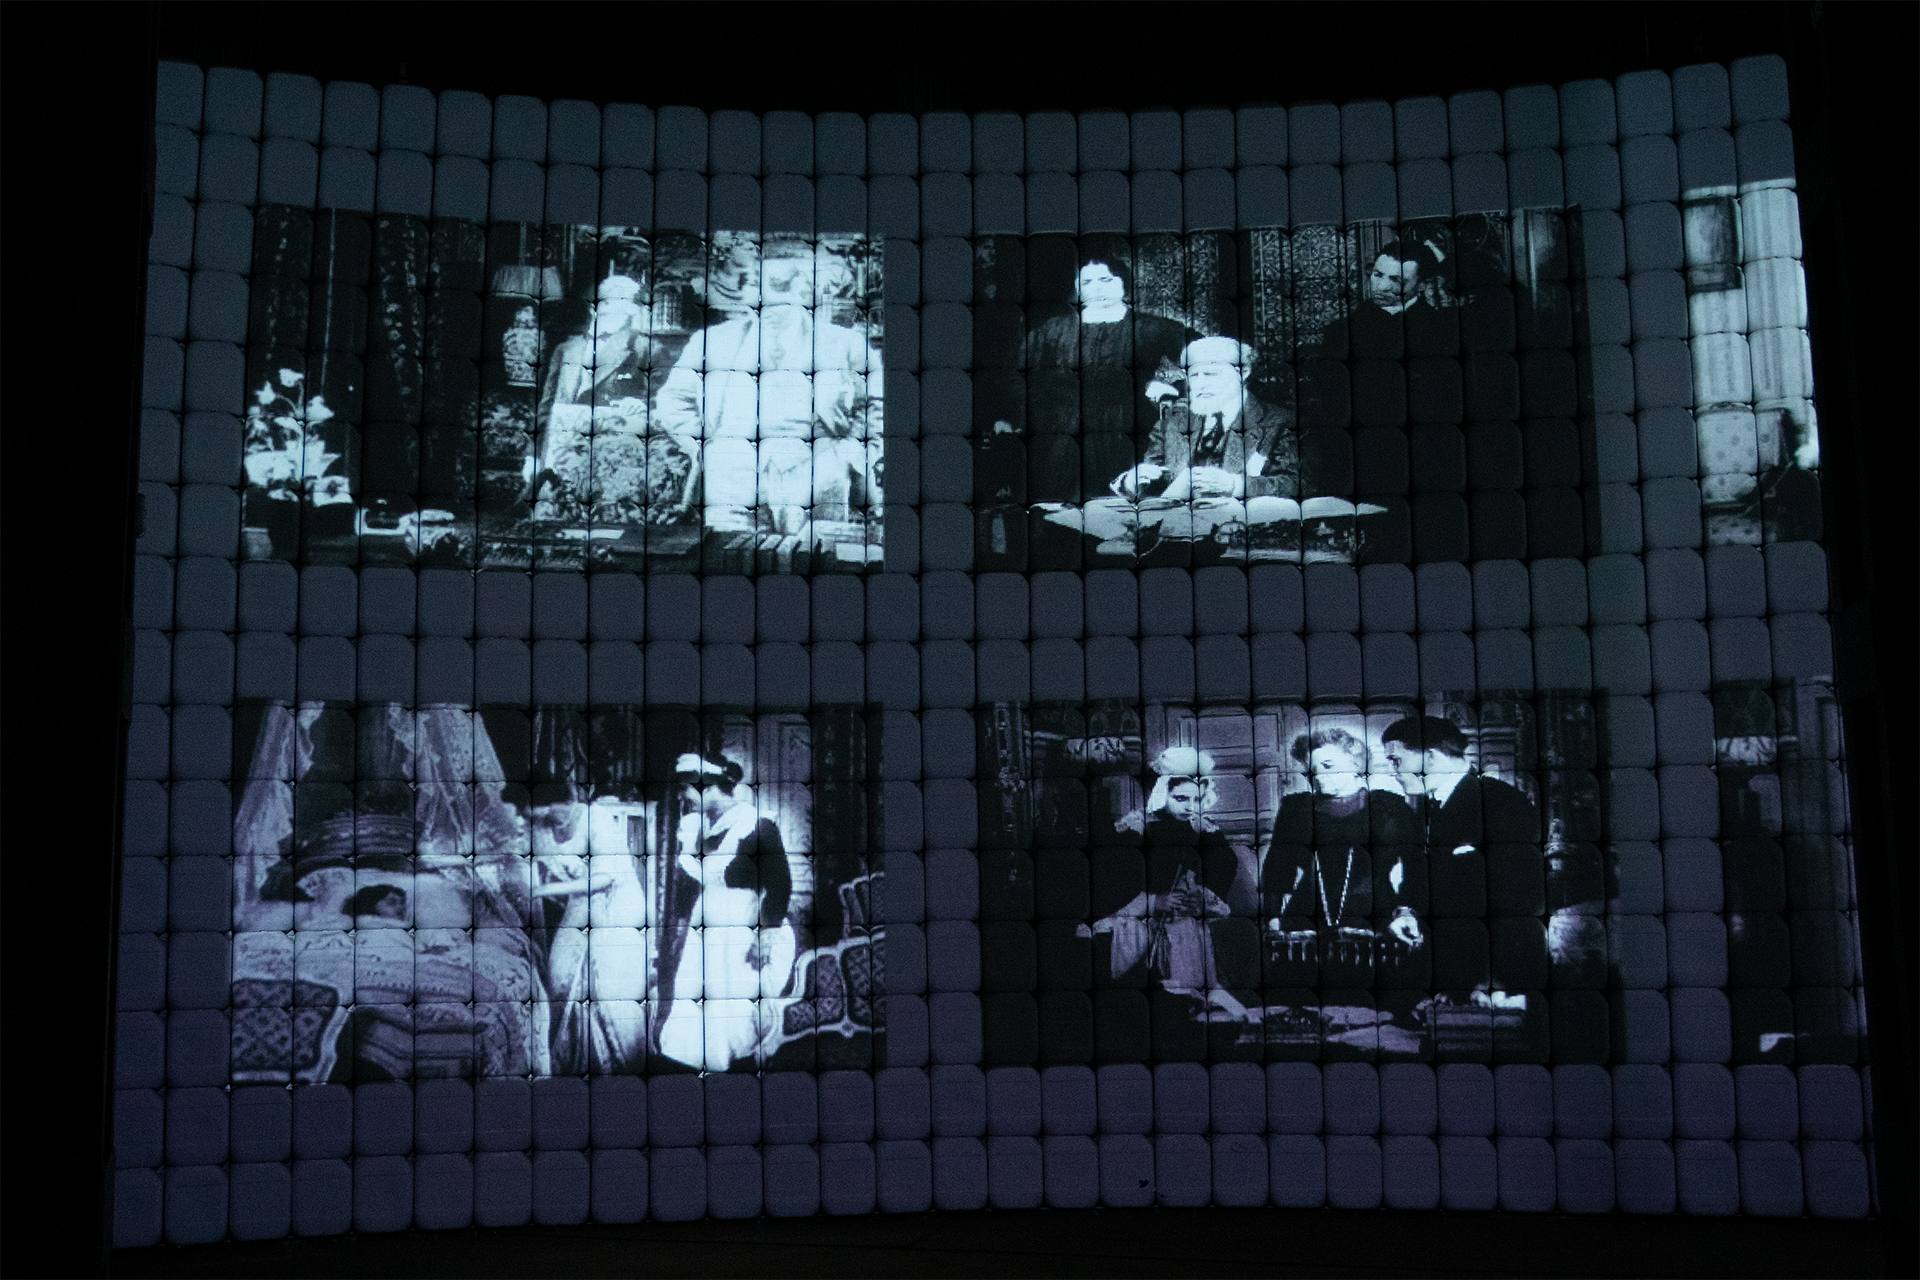
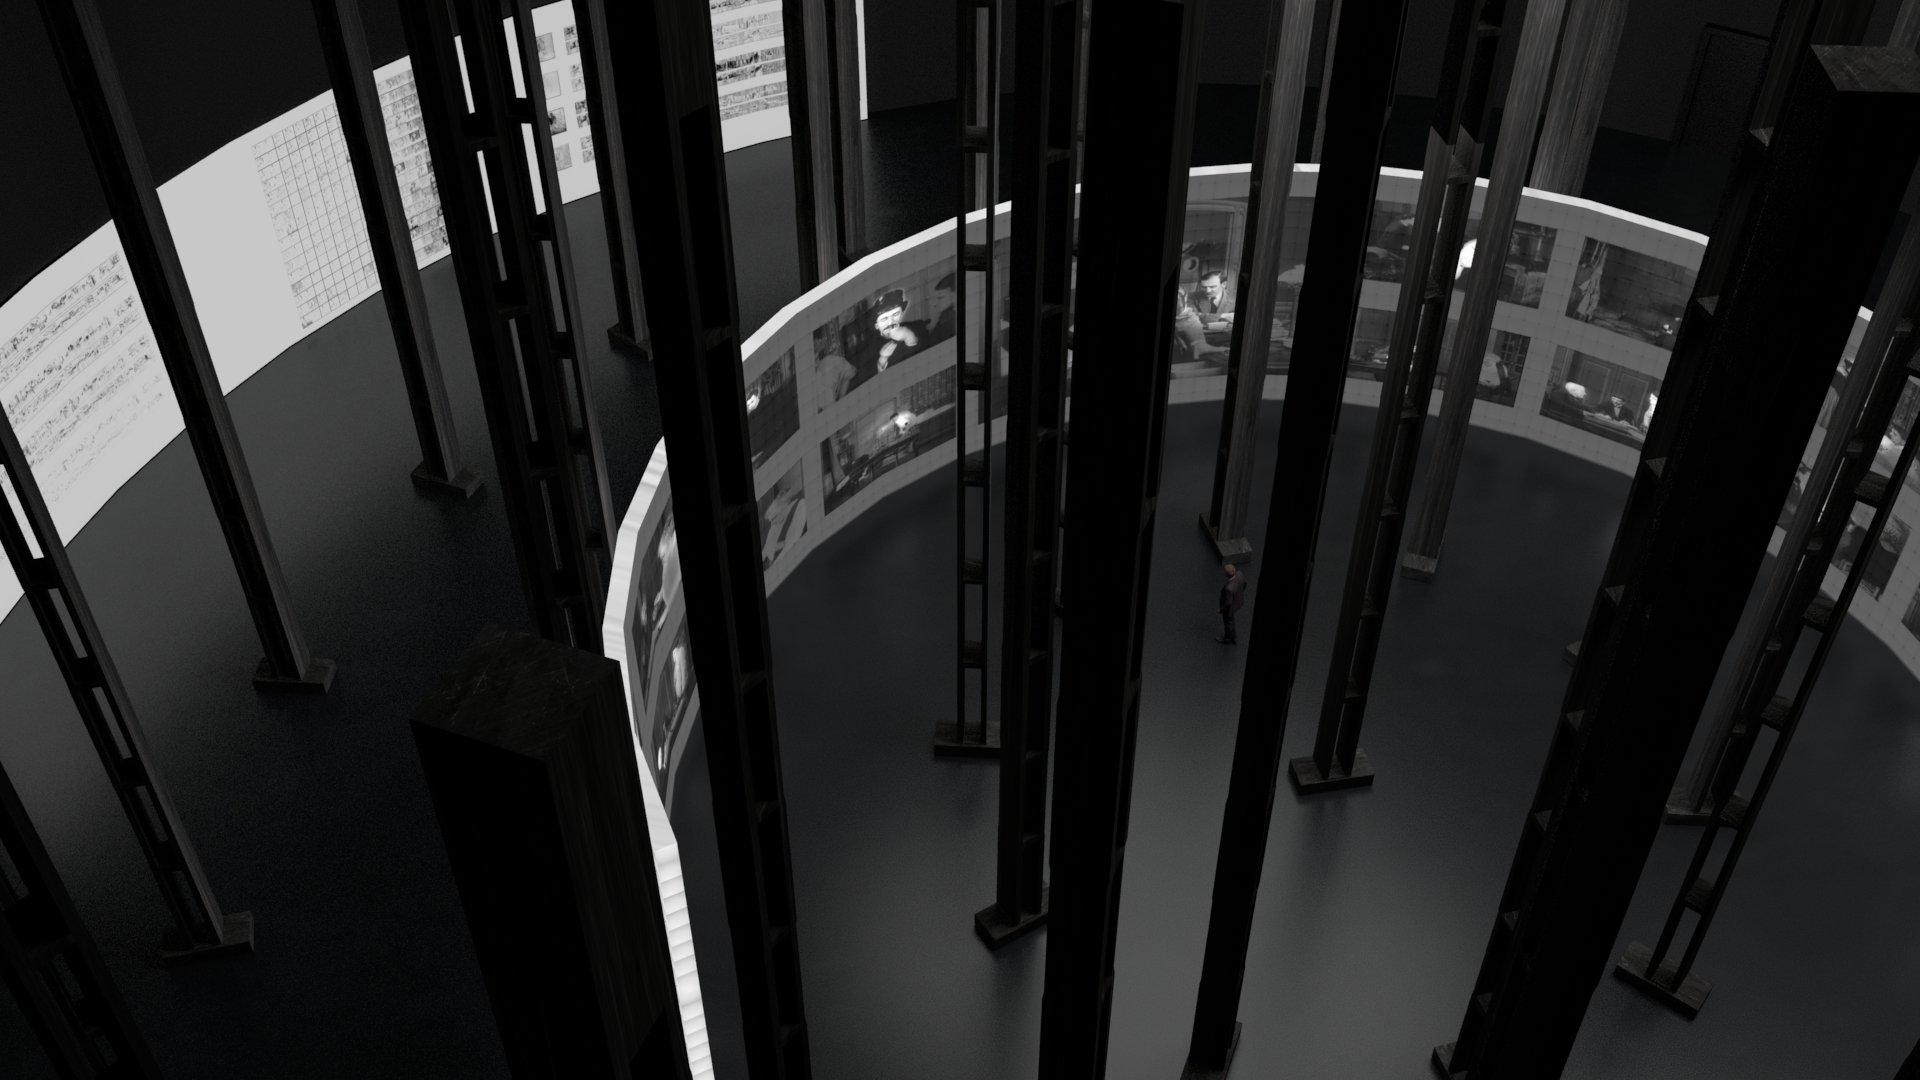
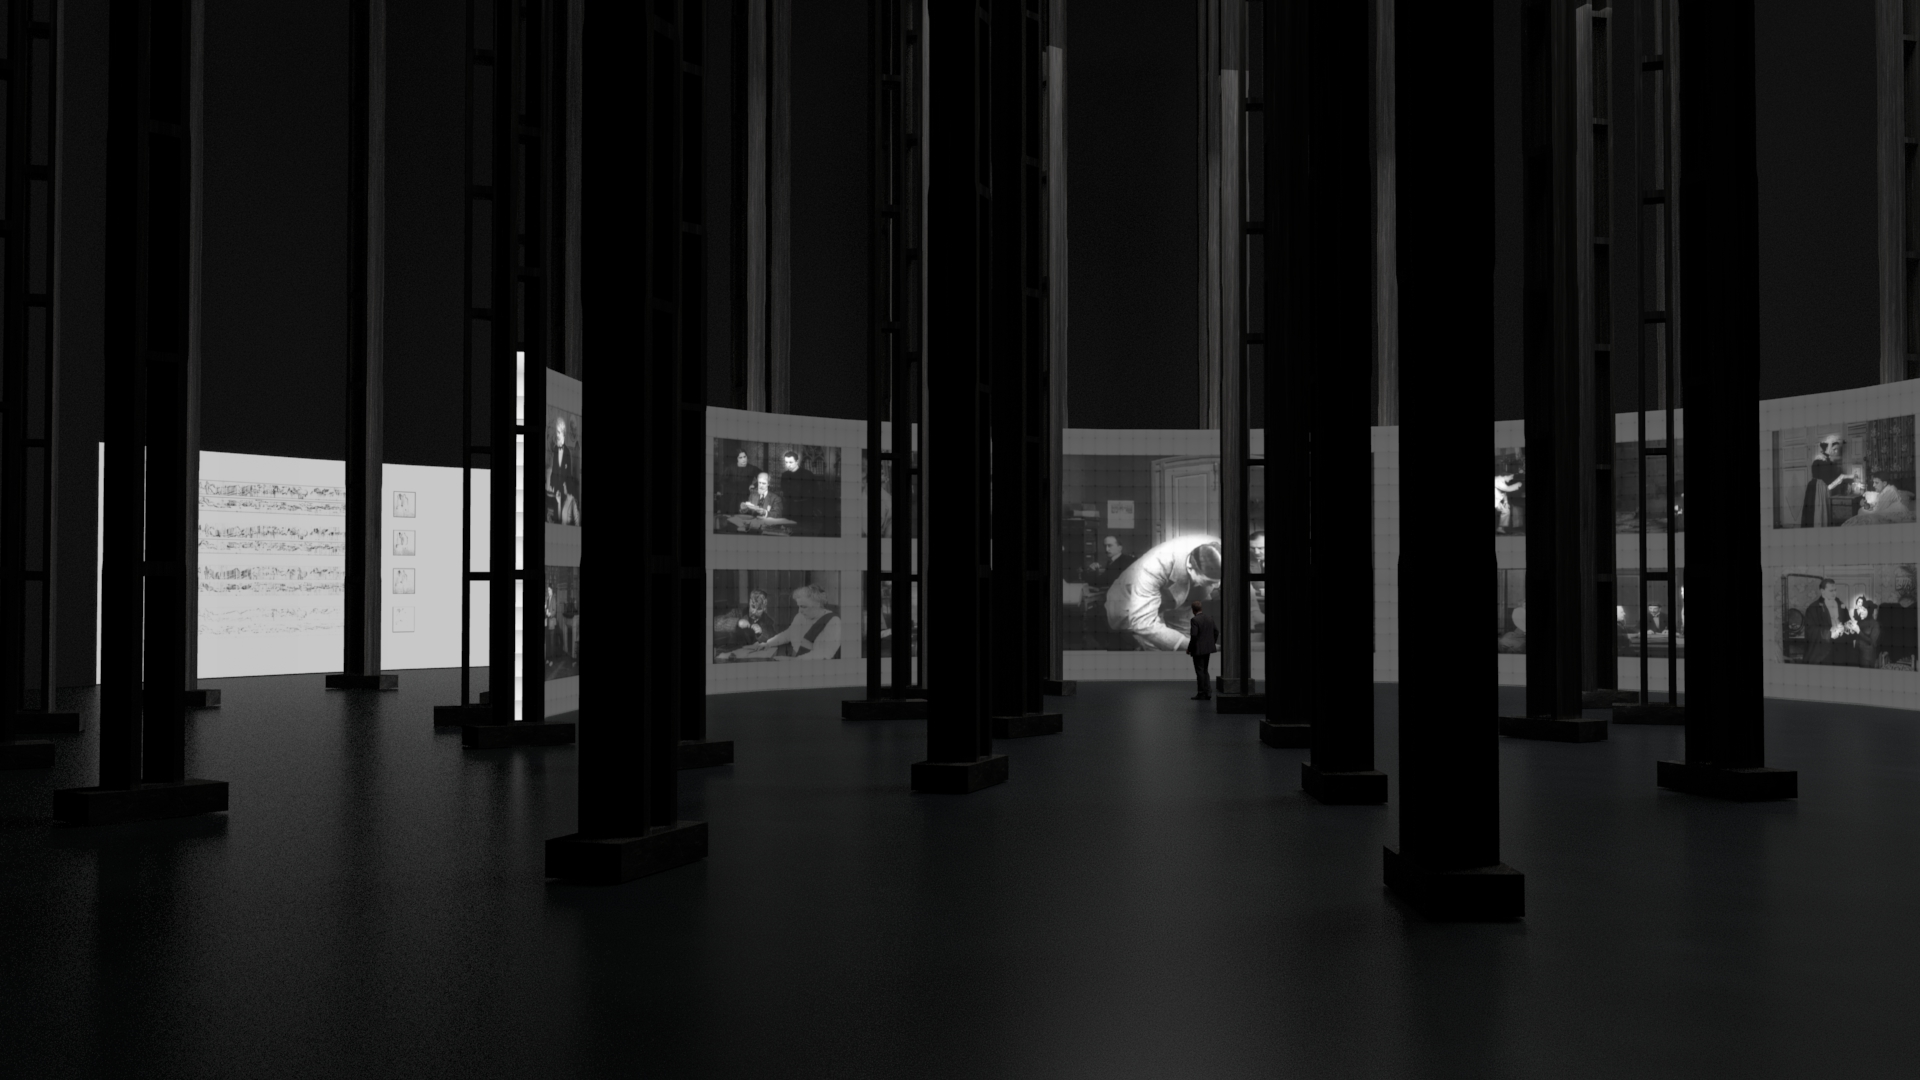
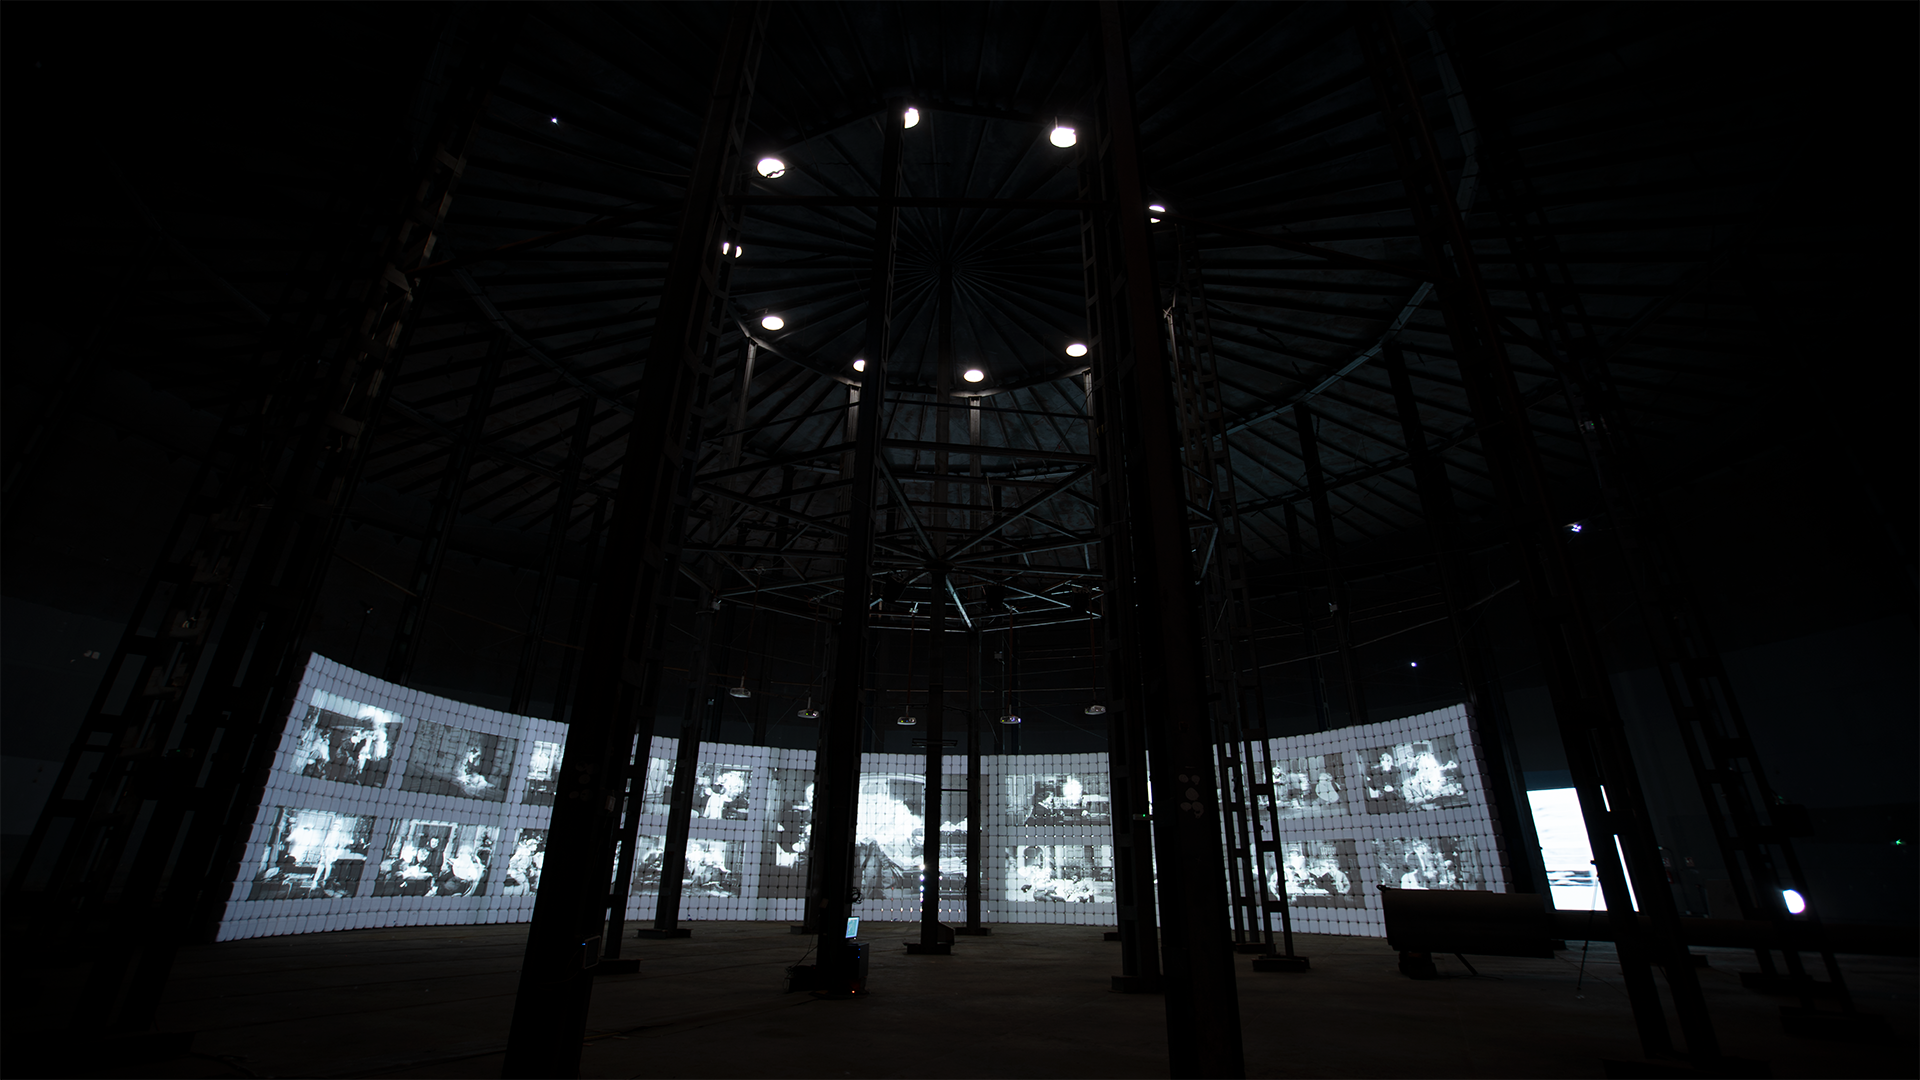
The exhibition’s main section consists of five synchronized video channels.
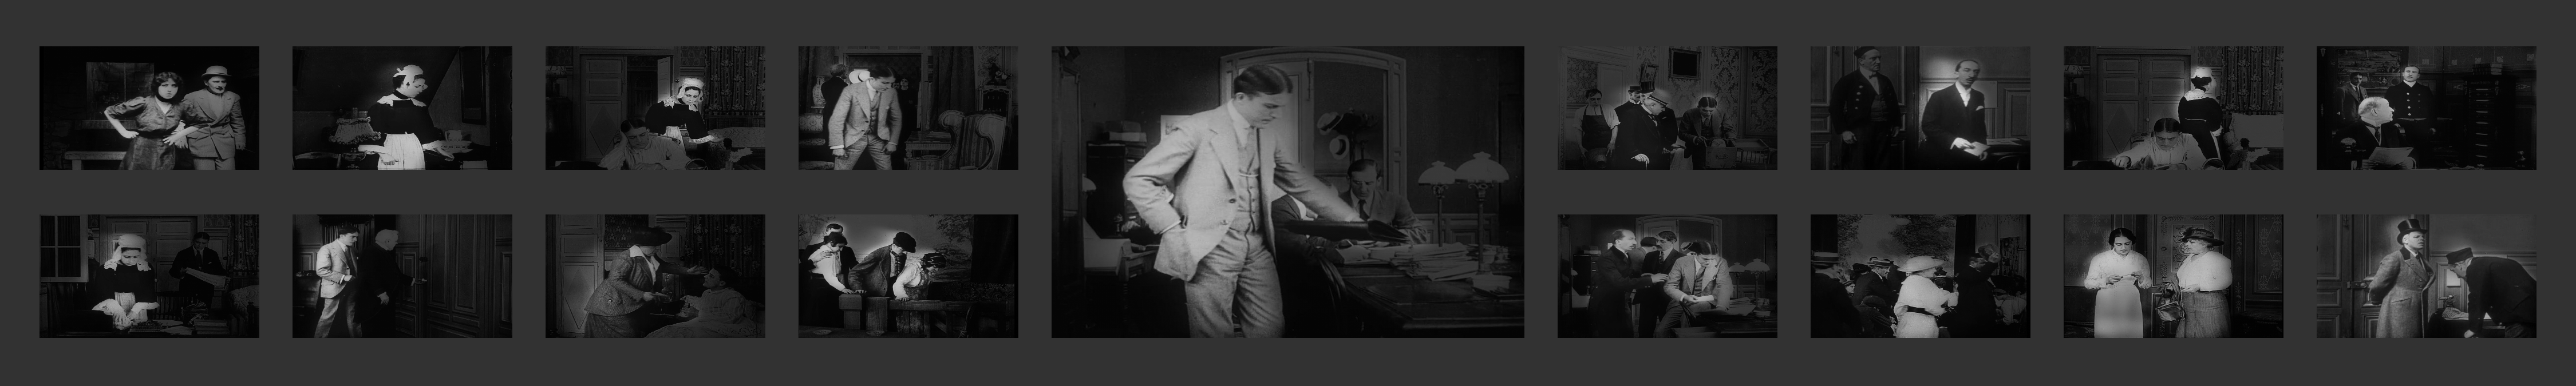
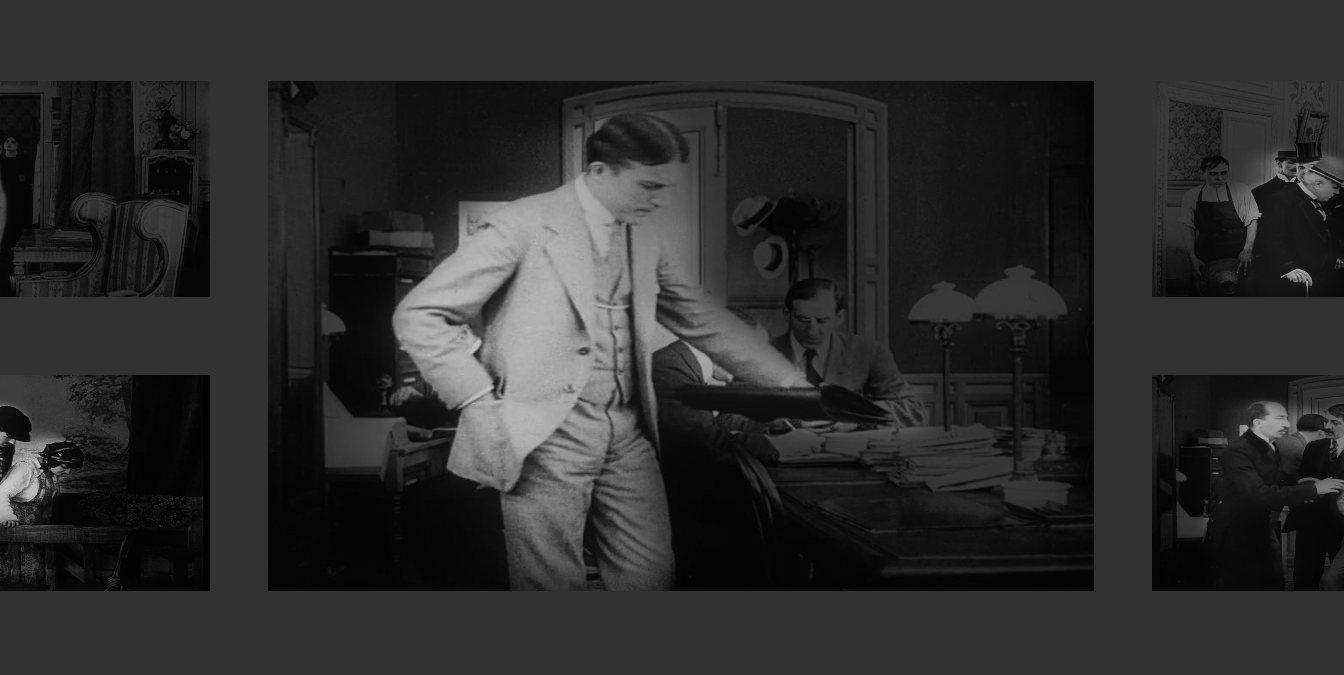
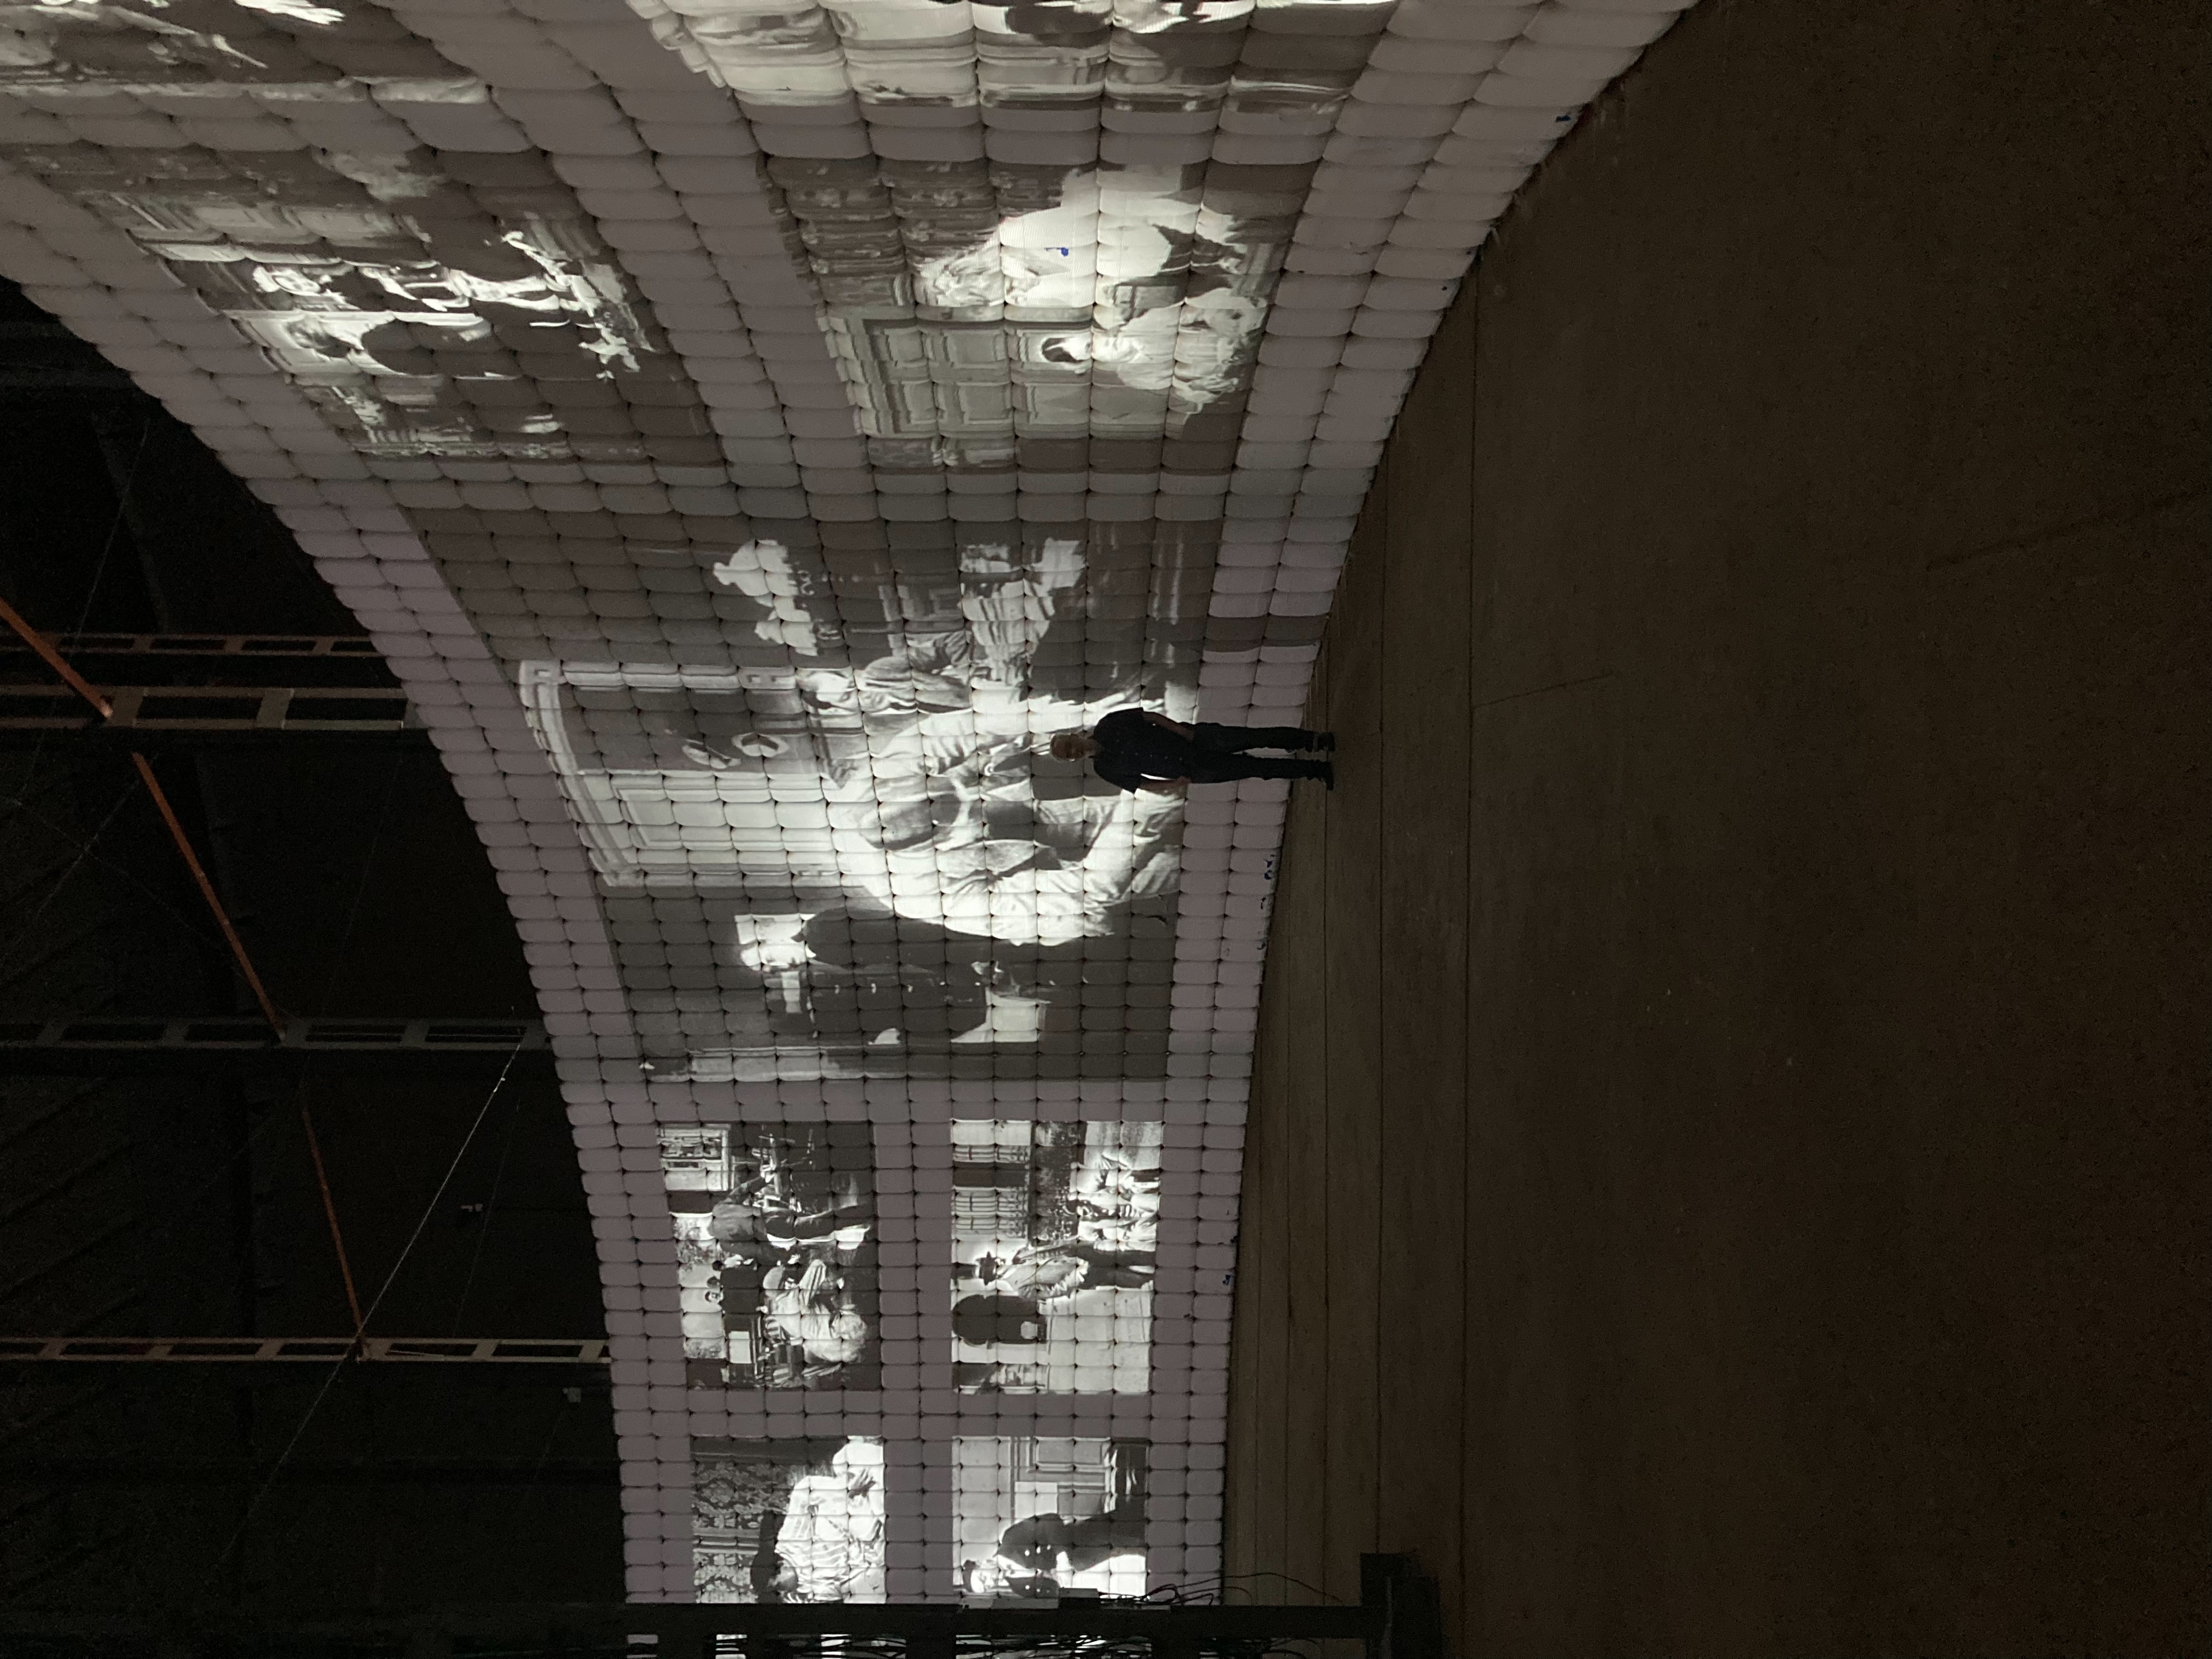
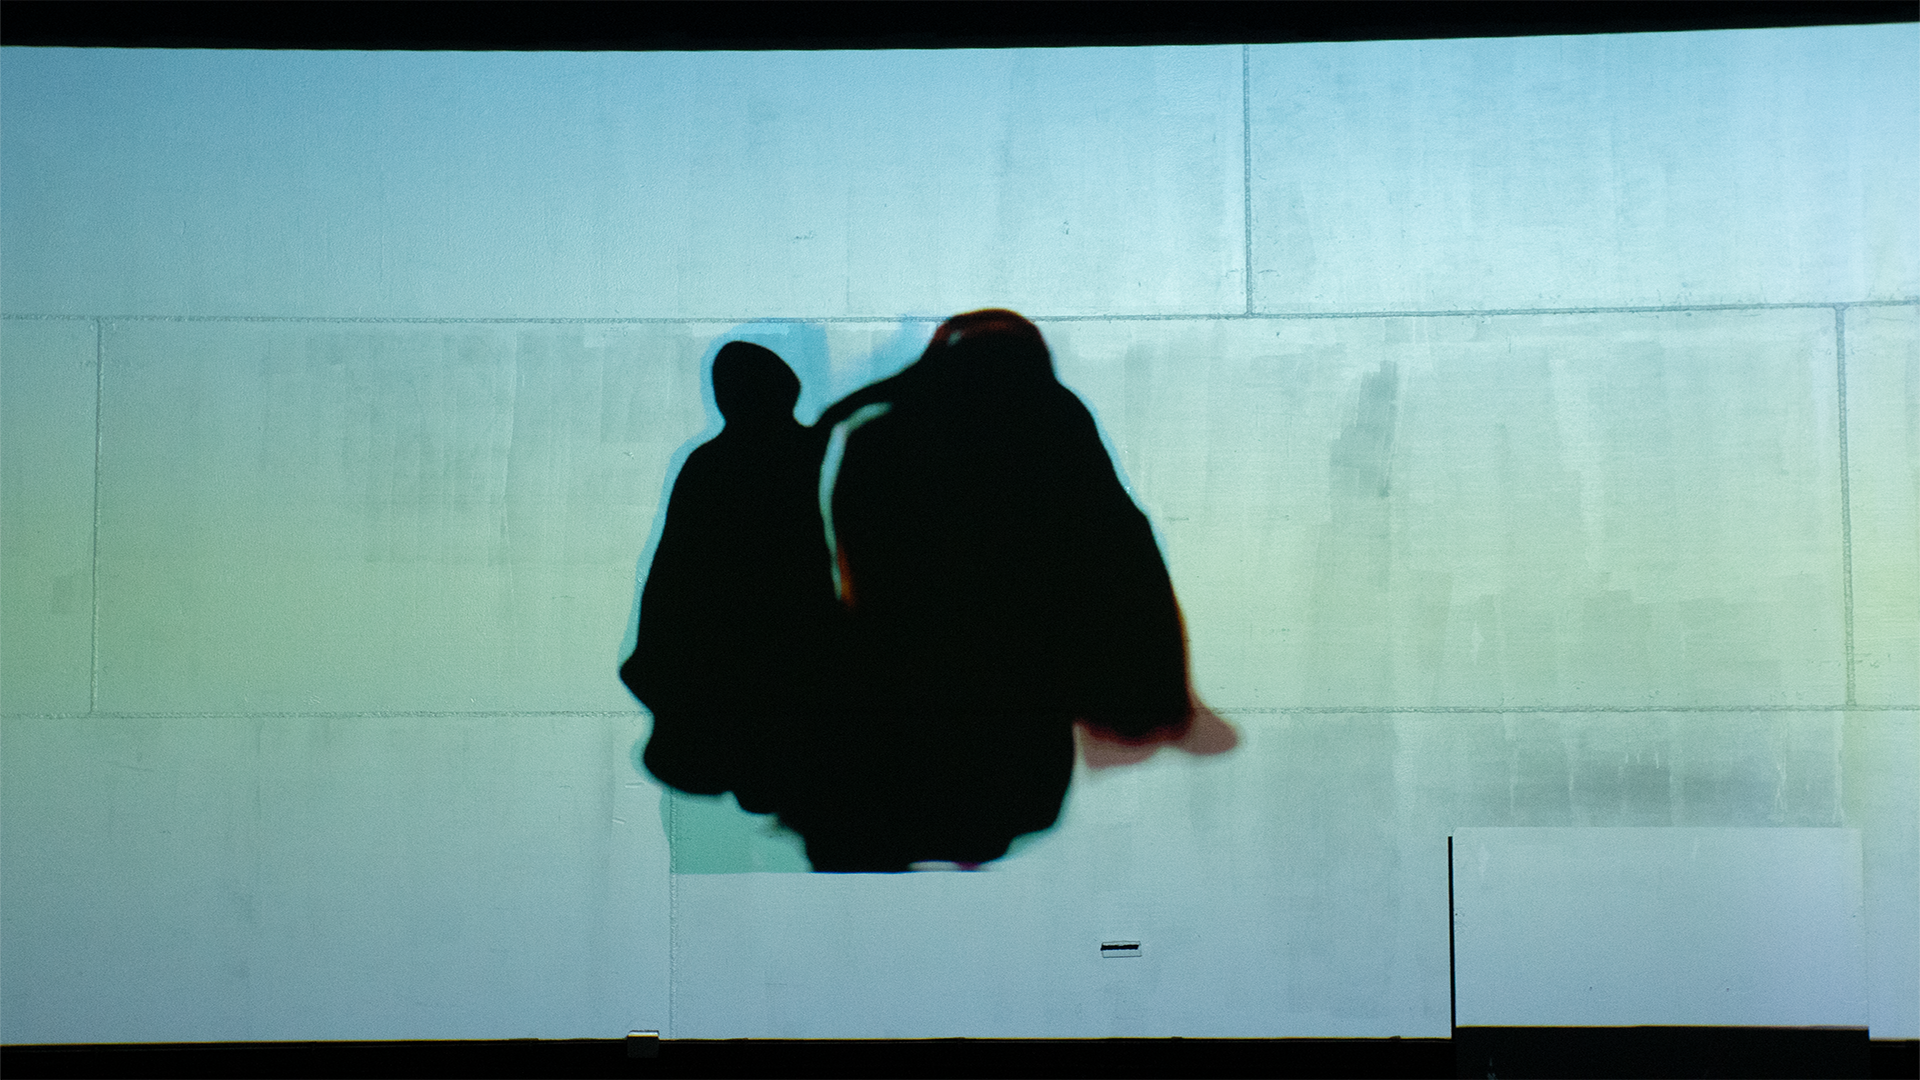
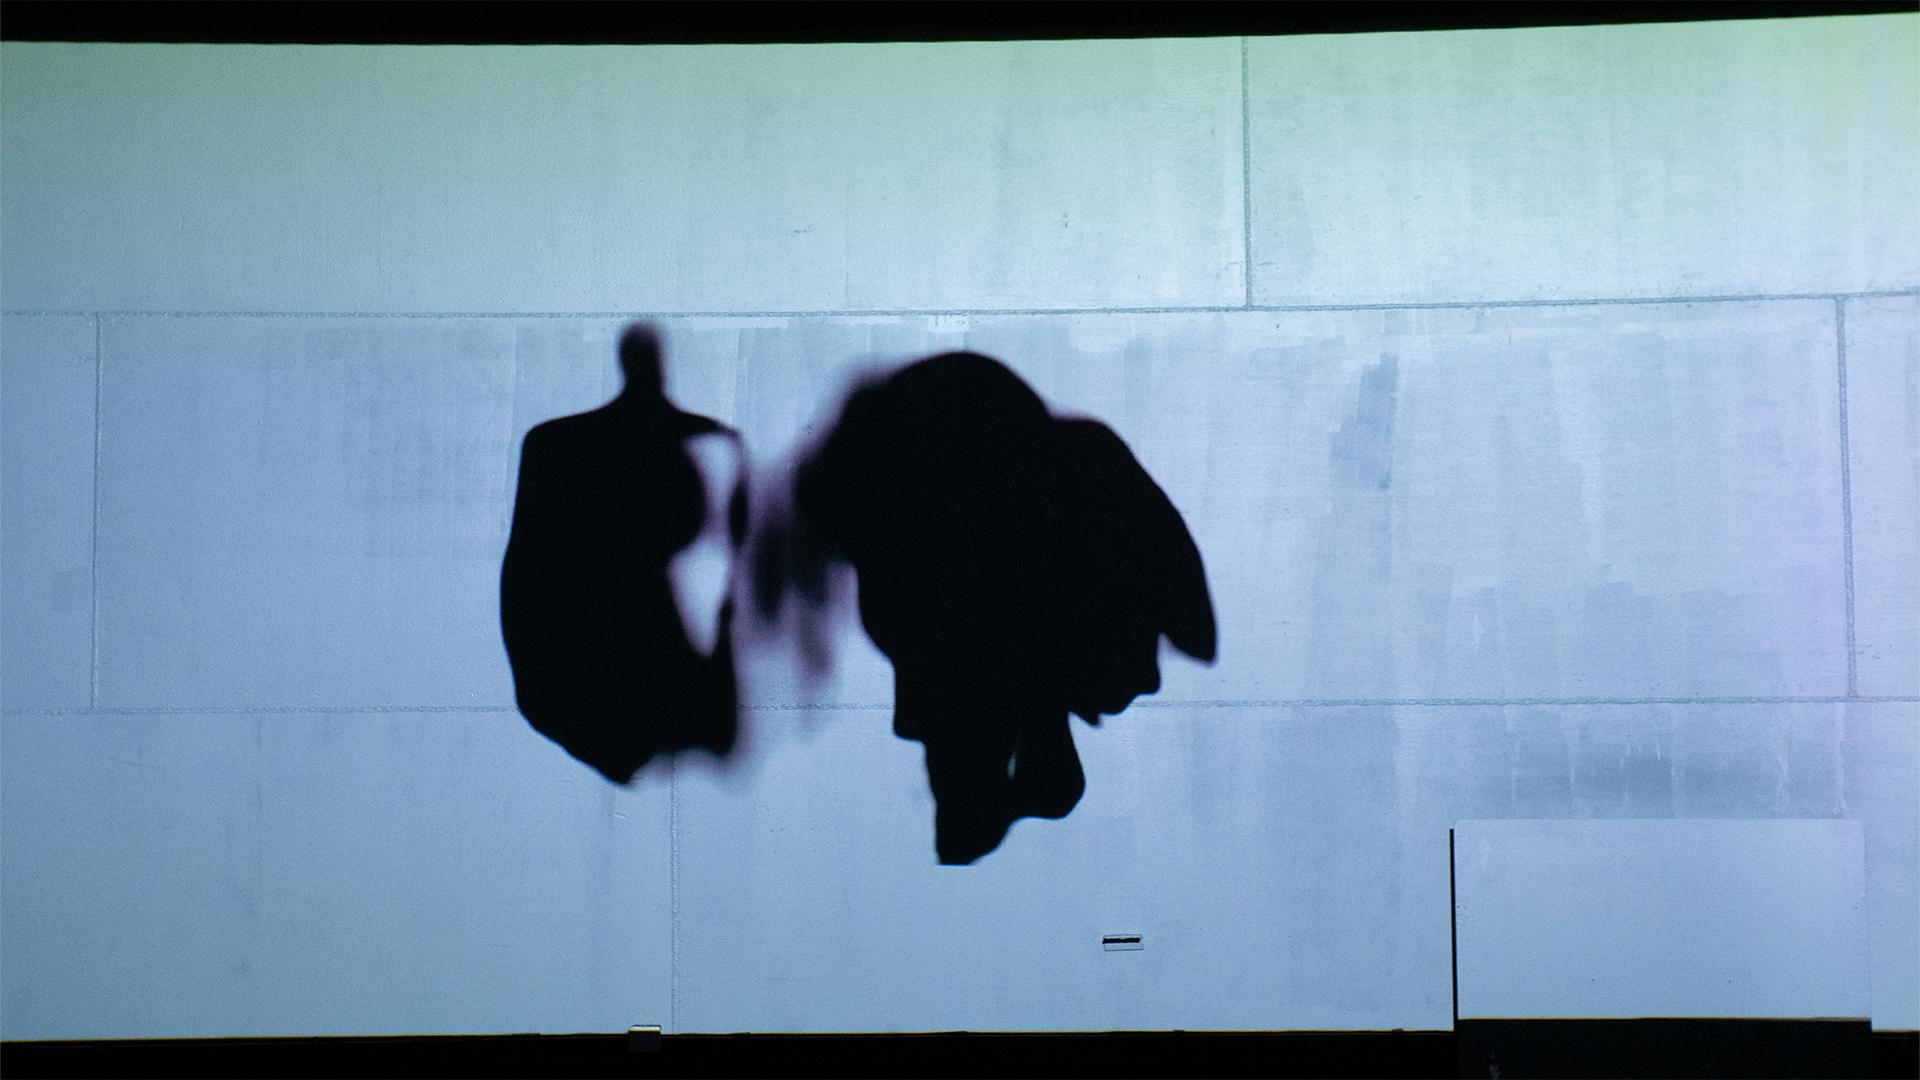
The center channel shows the opening sequence of Les Vampires.
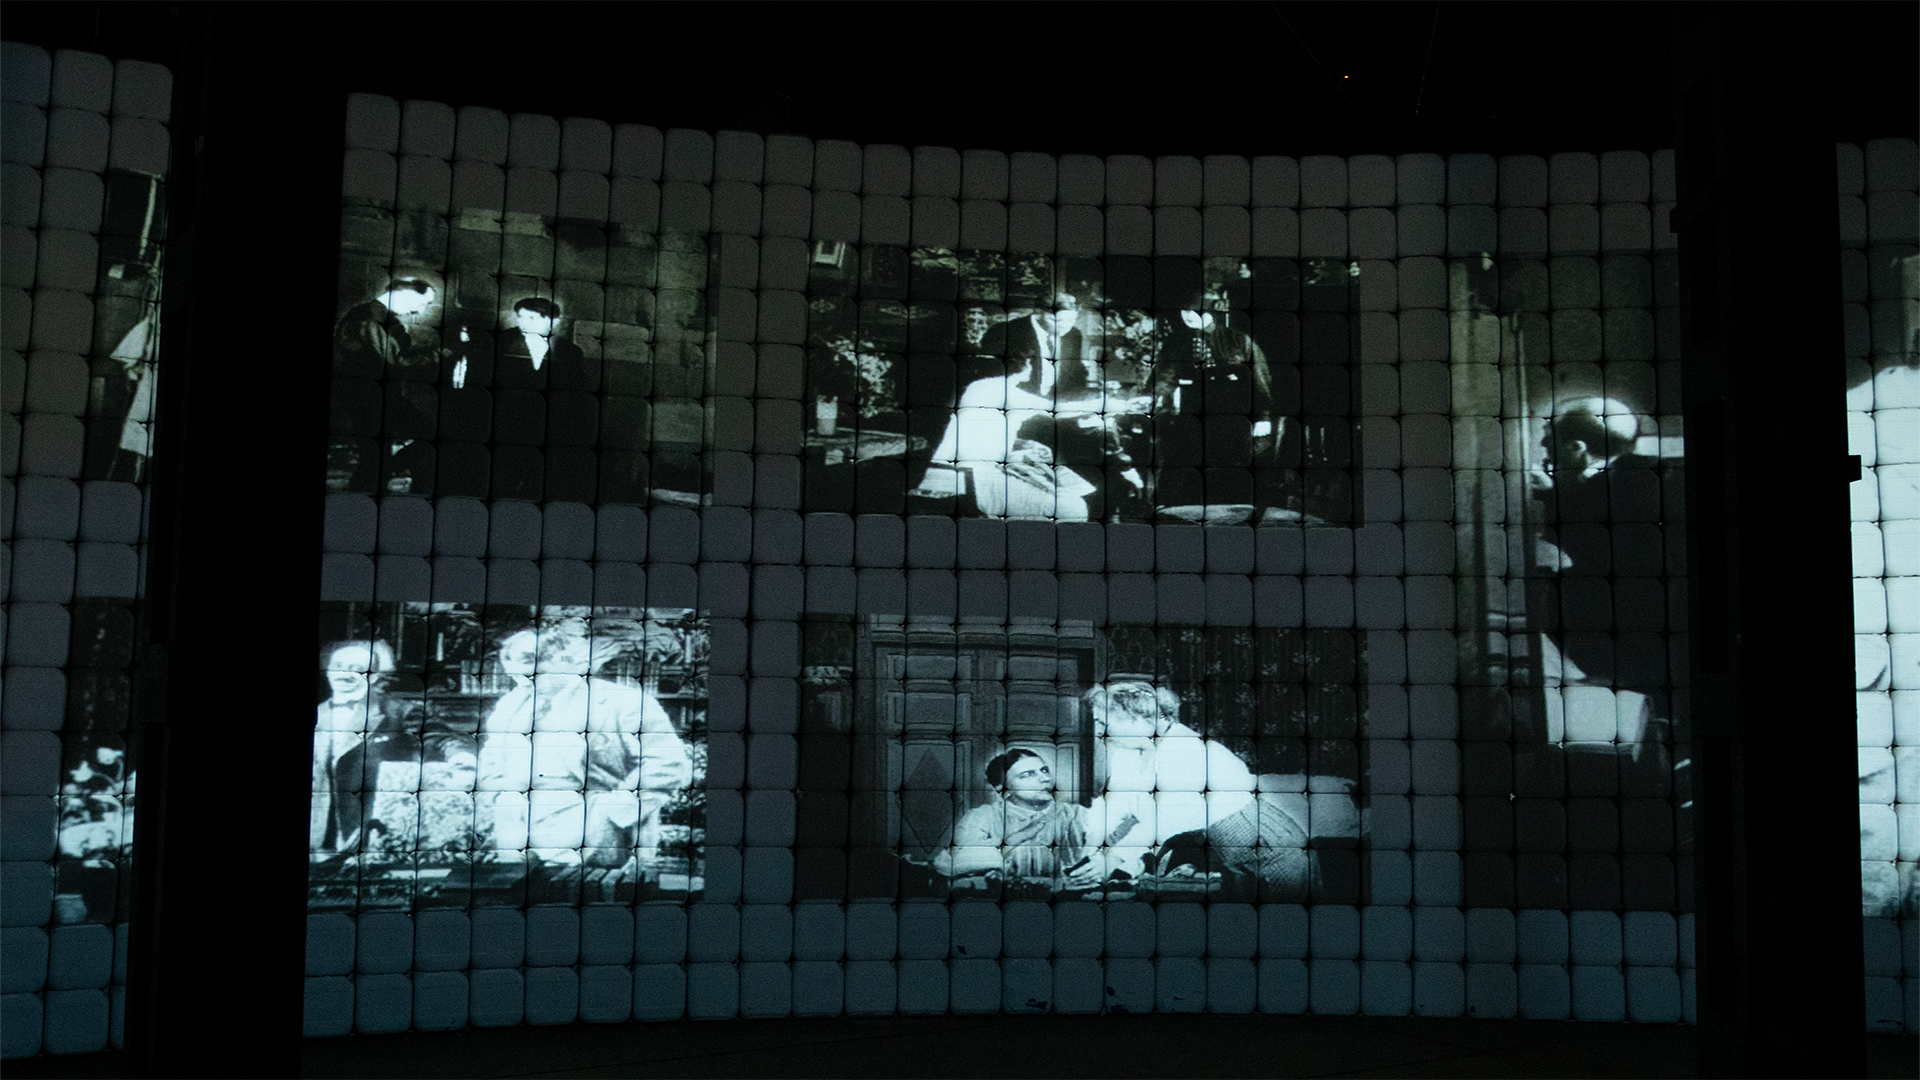
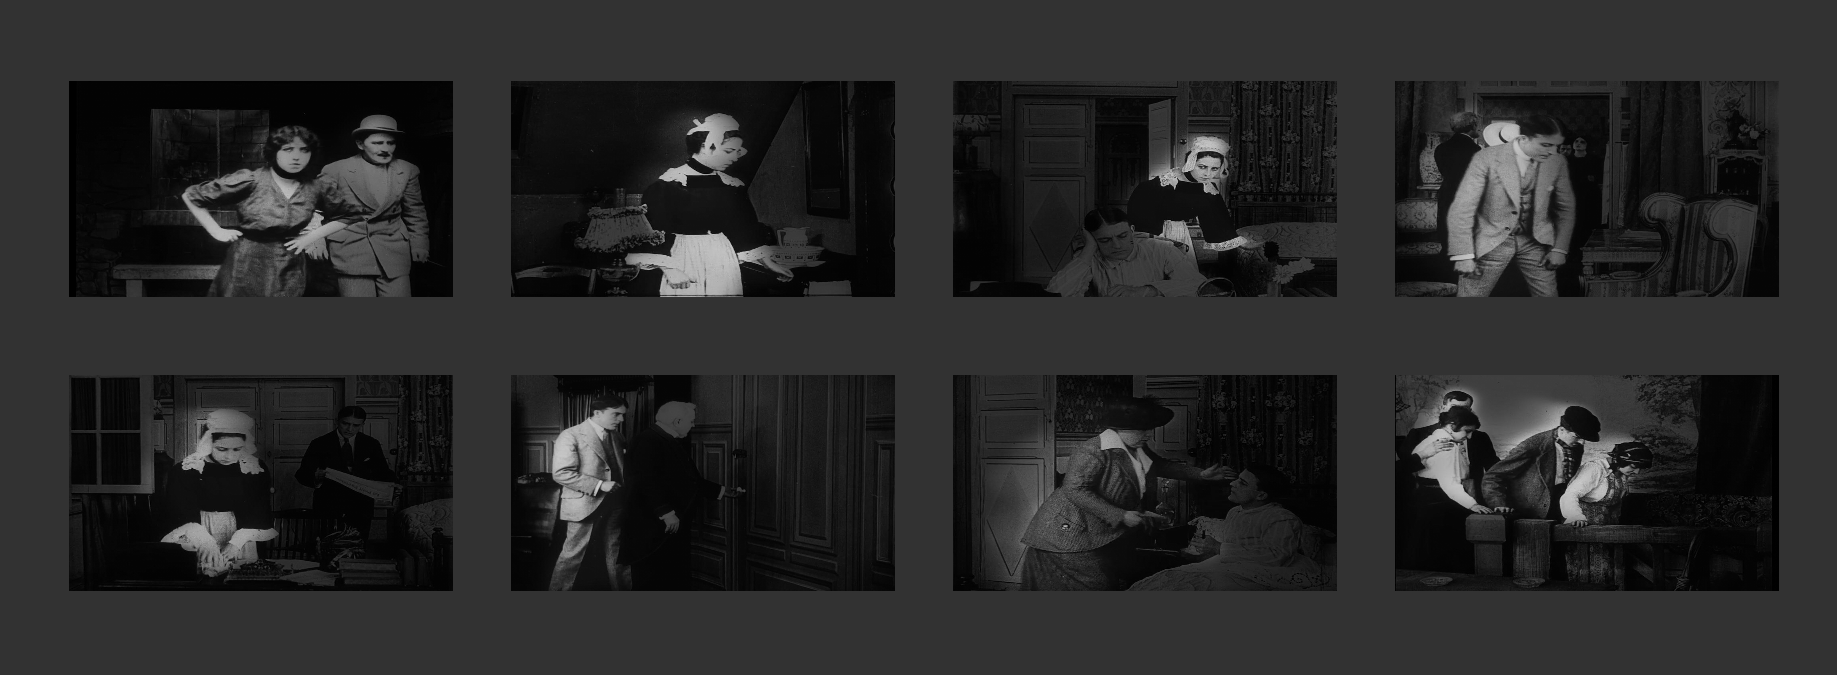
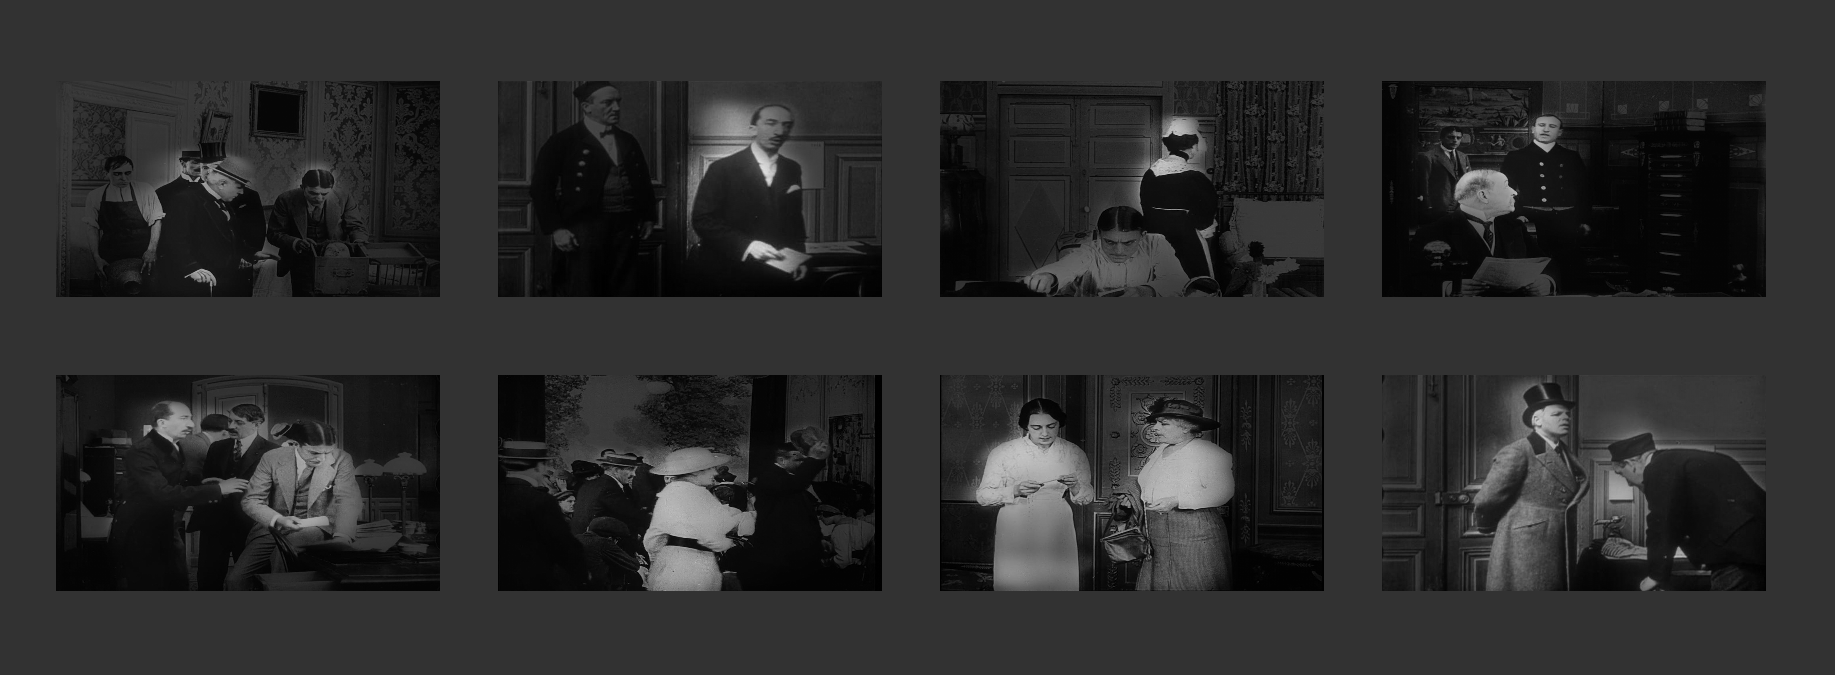
Sixteen matching scenes selected automatically by the neural network are shown to the right and left of the central sequence. This arrangement is designed to encourage viewers to pay close attention to, as well as to compare, the movements that occur in the various scenes.
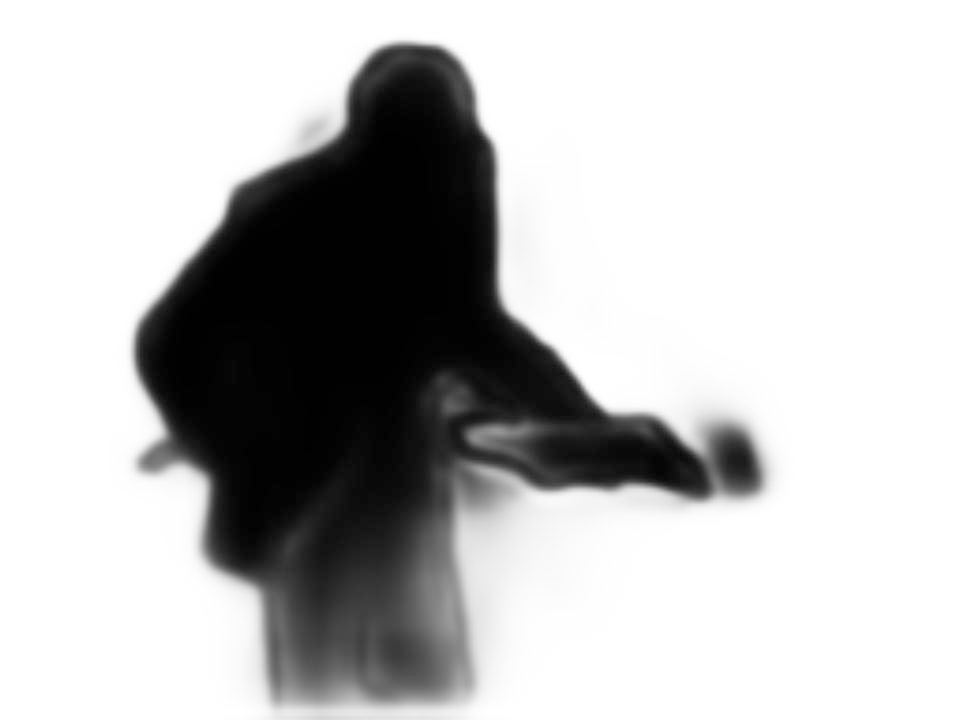
The neural network does not take into account the type of object that moves, be it person, animal, machine, etc., focusing instead on the movement for its own sake. To understand the installation, the visitor must take note of the purely kinetic similarities that obtain between the various sequences. Since the network detects very subtle movements, which a human observer cannot always perceive easily, all the sequences have been slowed down using another neural network. This extreme slowness allows the viewer to pay close attention to the movement of each image and thus learn to see according to the impersonal gaze of the algorithm. To guide the audience's vision, the less relevant areas of each frame have been slightly obscured thanks to a third neural network that models visual attention.
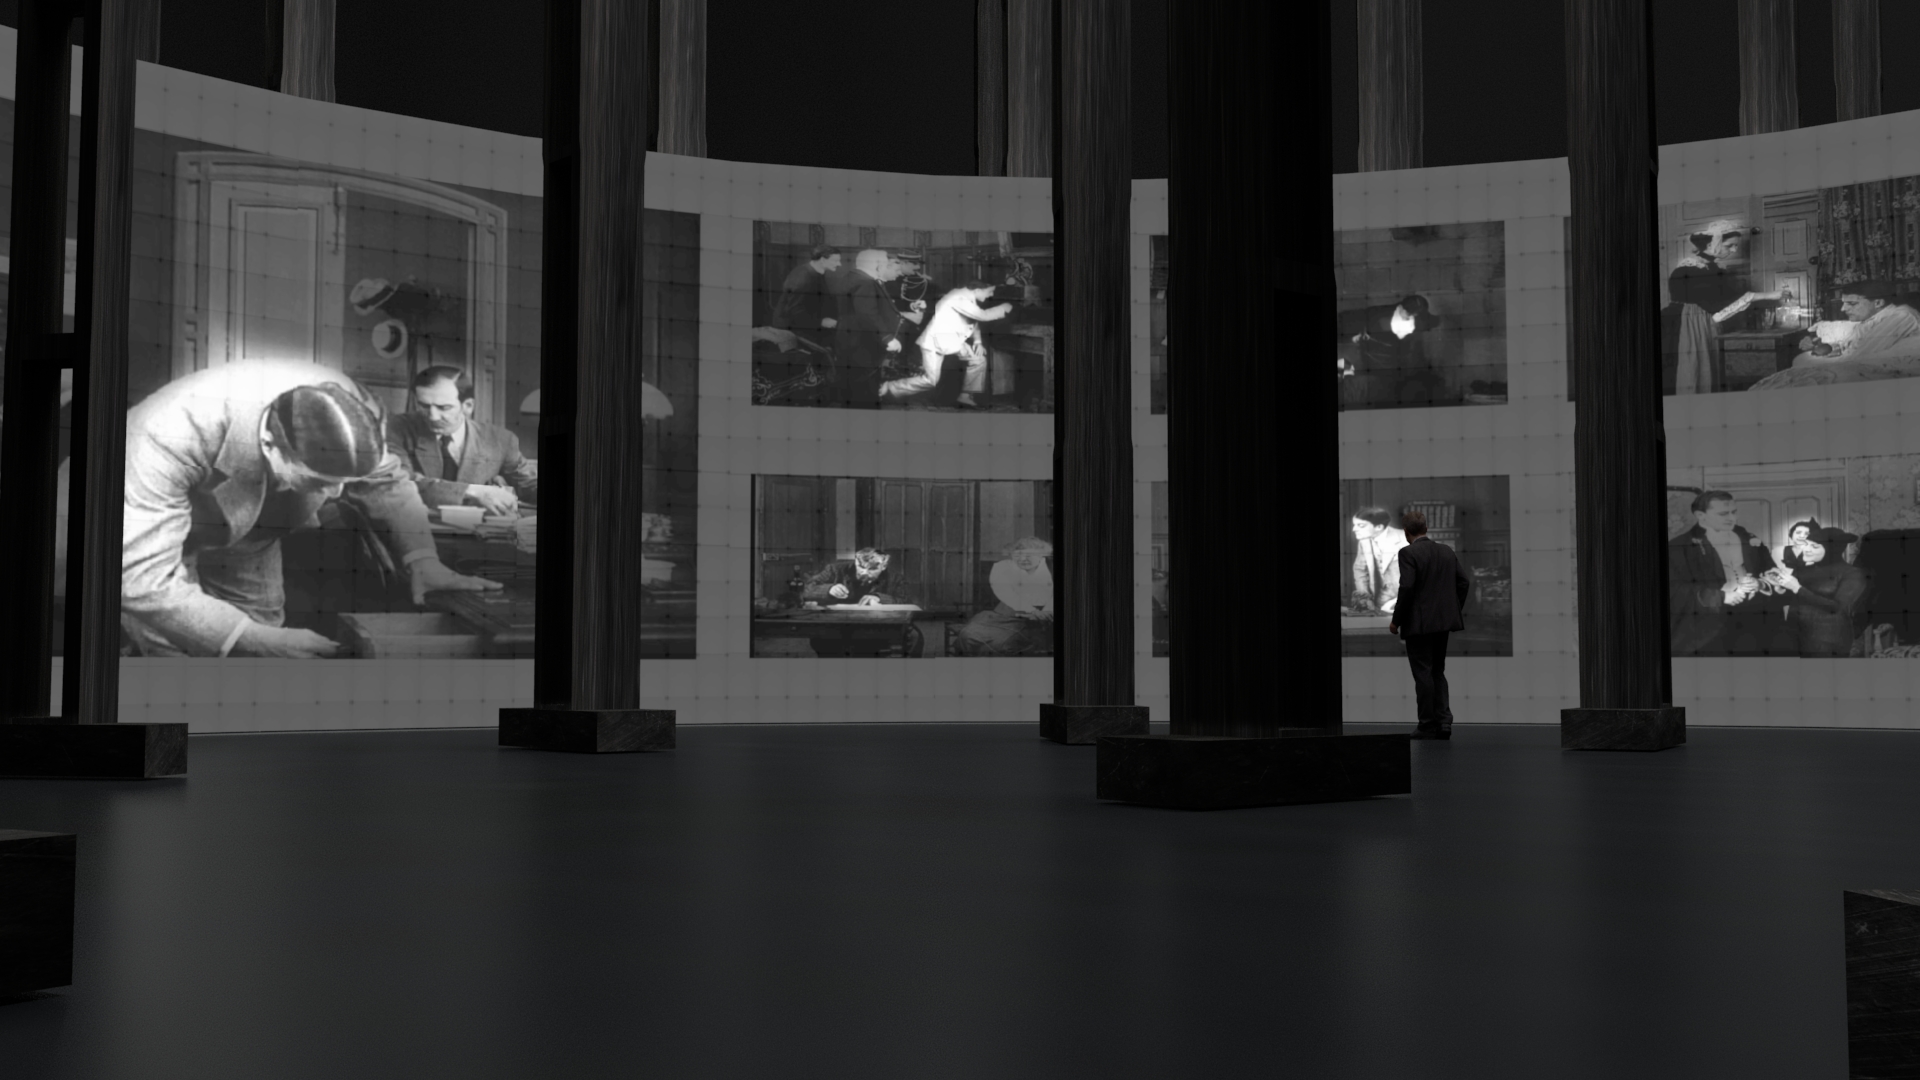
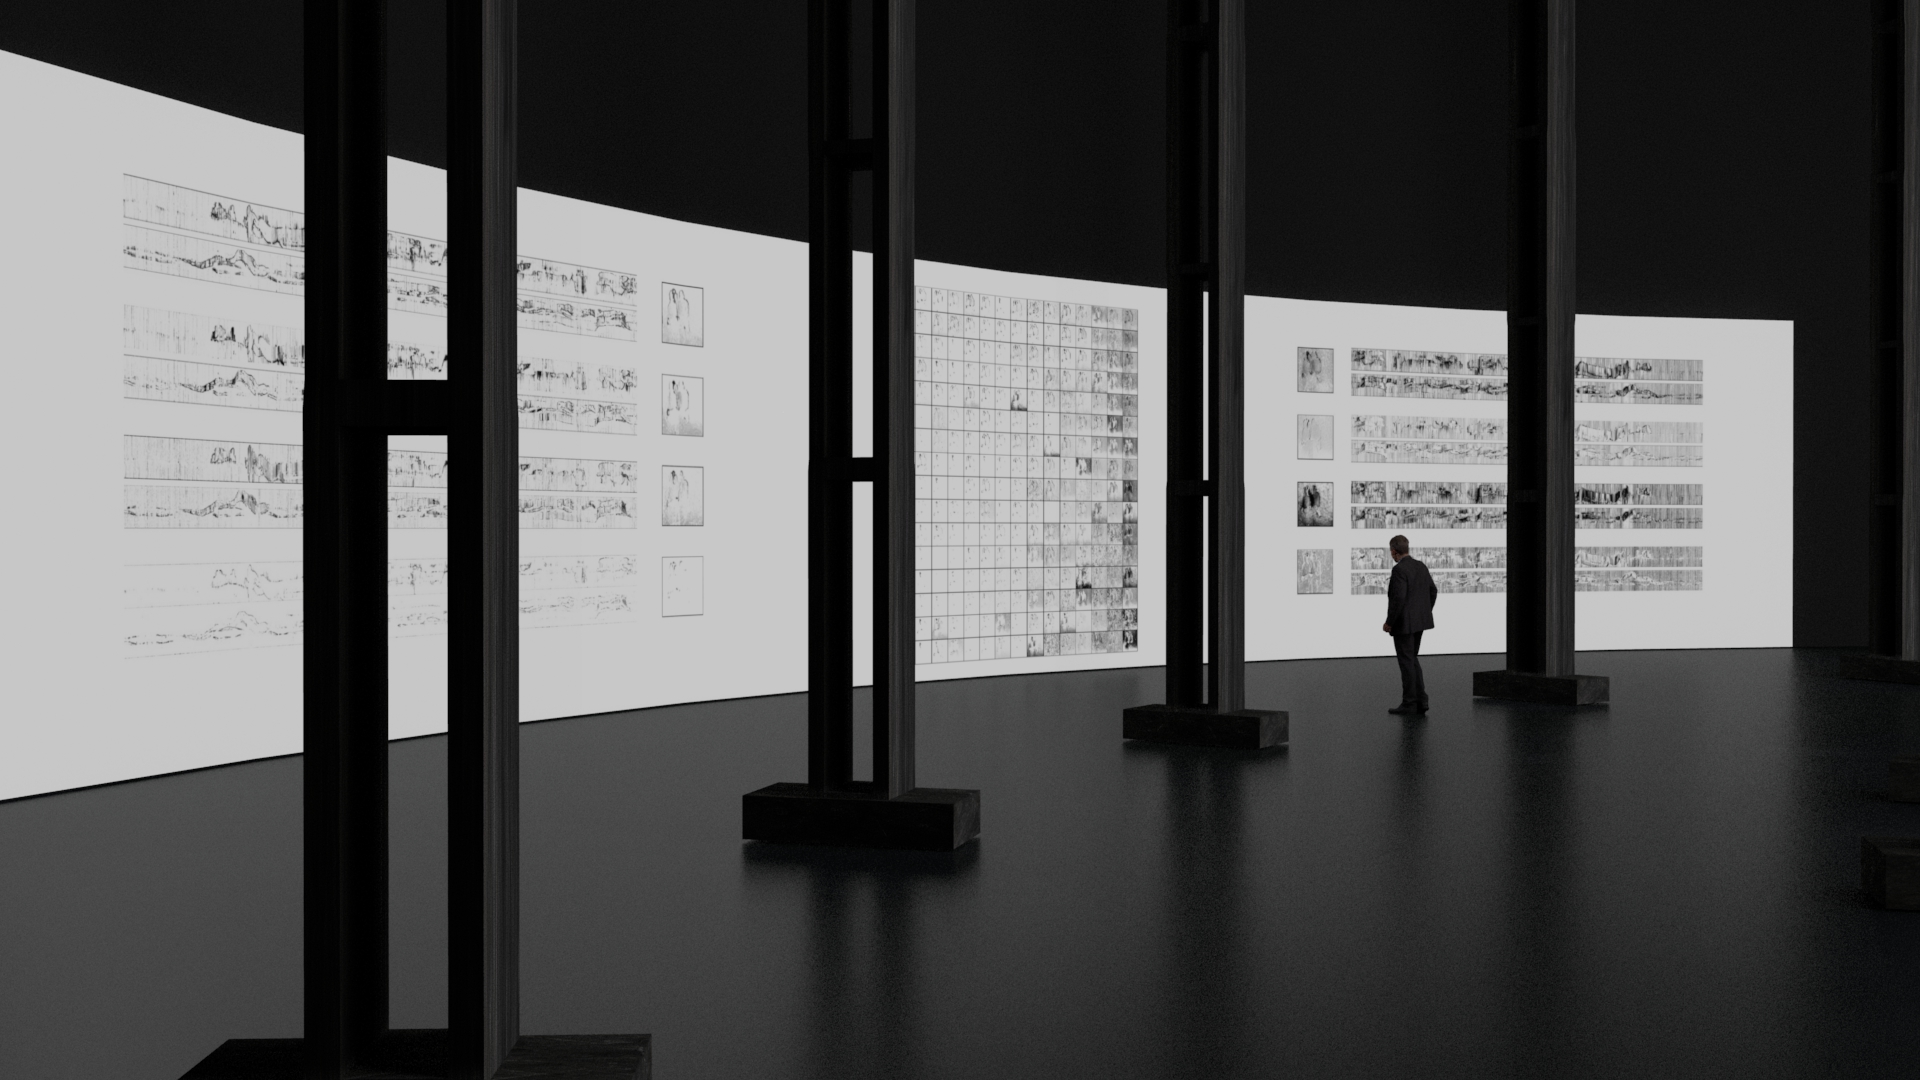
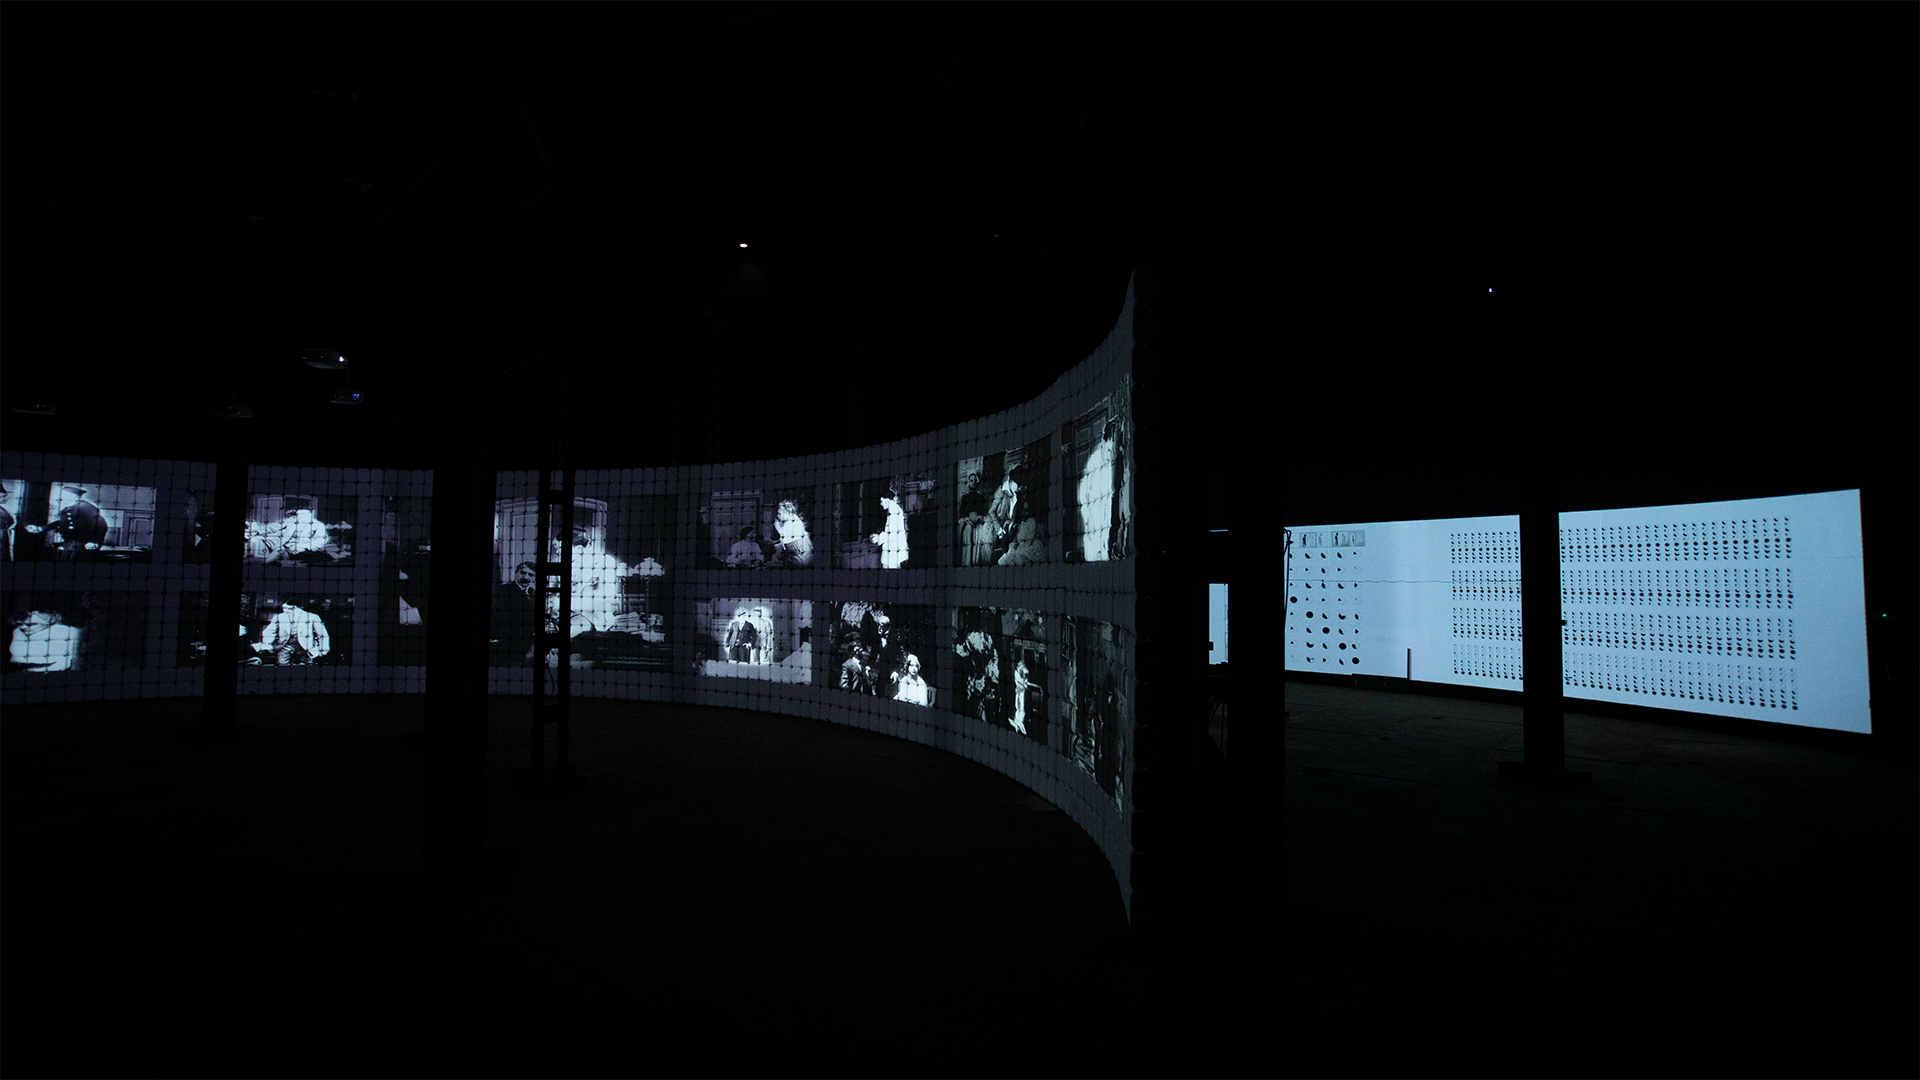
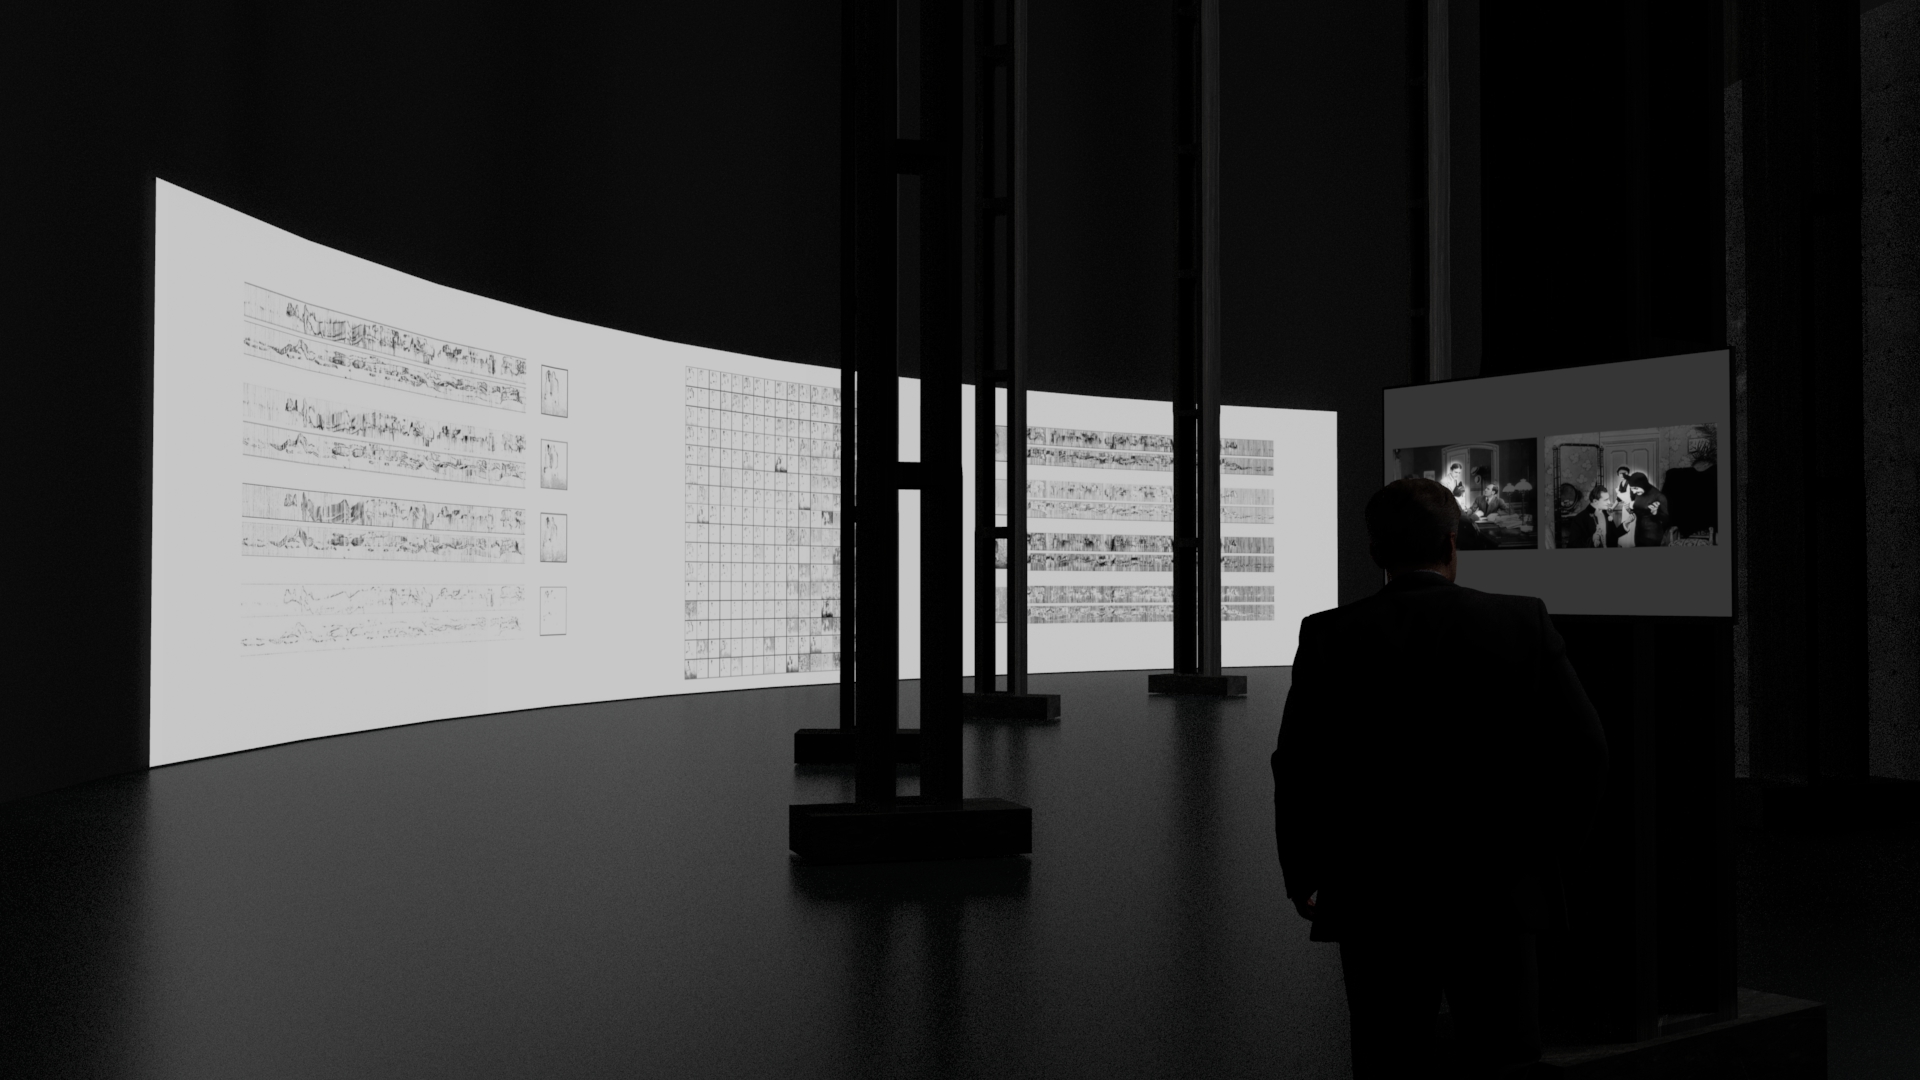
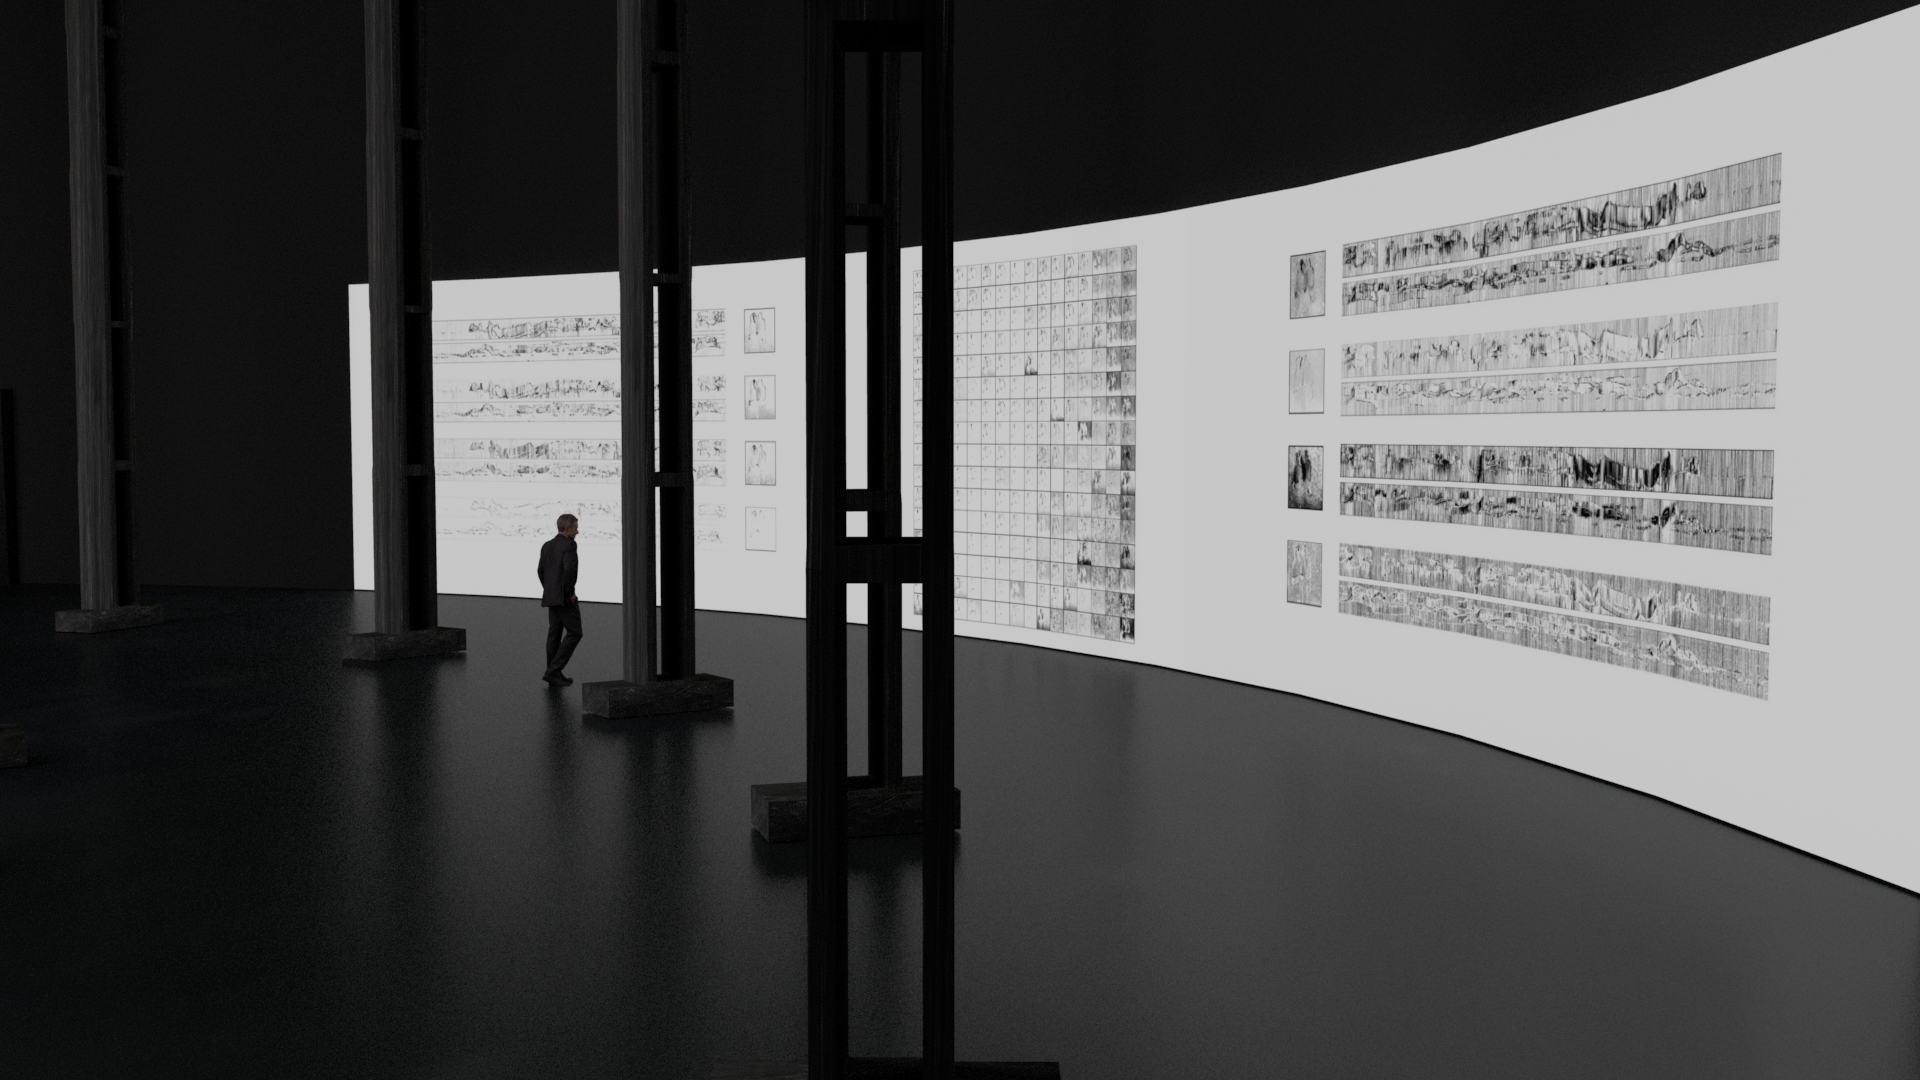
A second component of the exhibition is a three-channel video that visualizes the internal structure of one of the neural networks used in the production of this installation.
This second component is shown behind the main component.
This placement is metaphorical, since this second component exposes some of the hidden mechanisms behind the production of the main video projection.
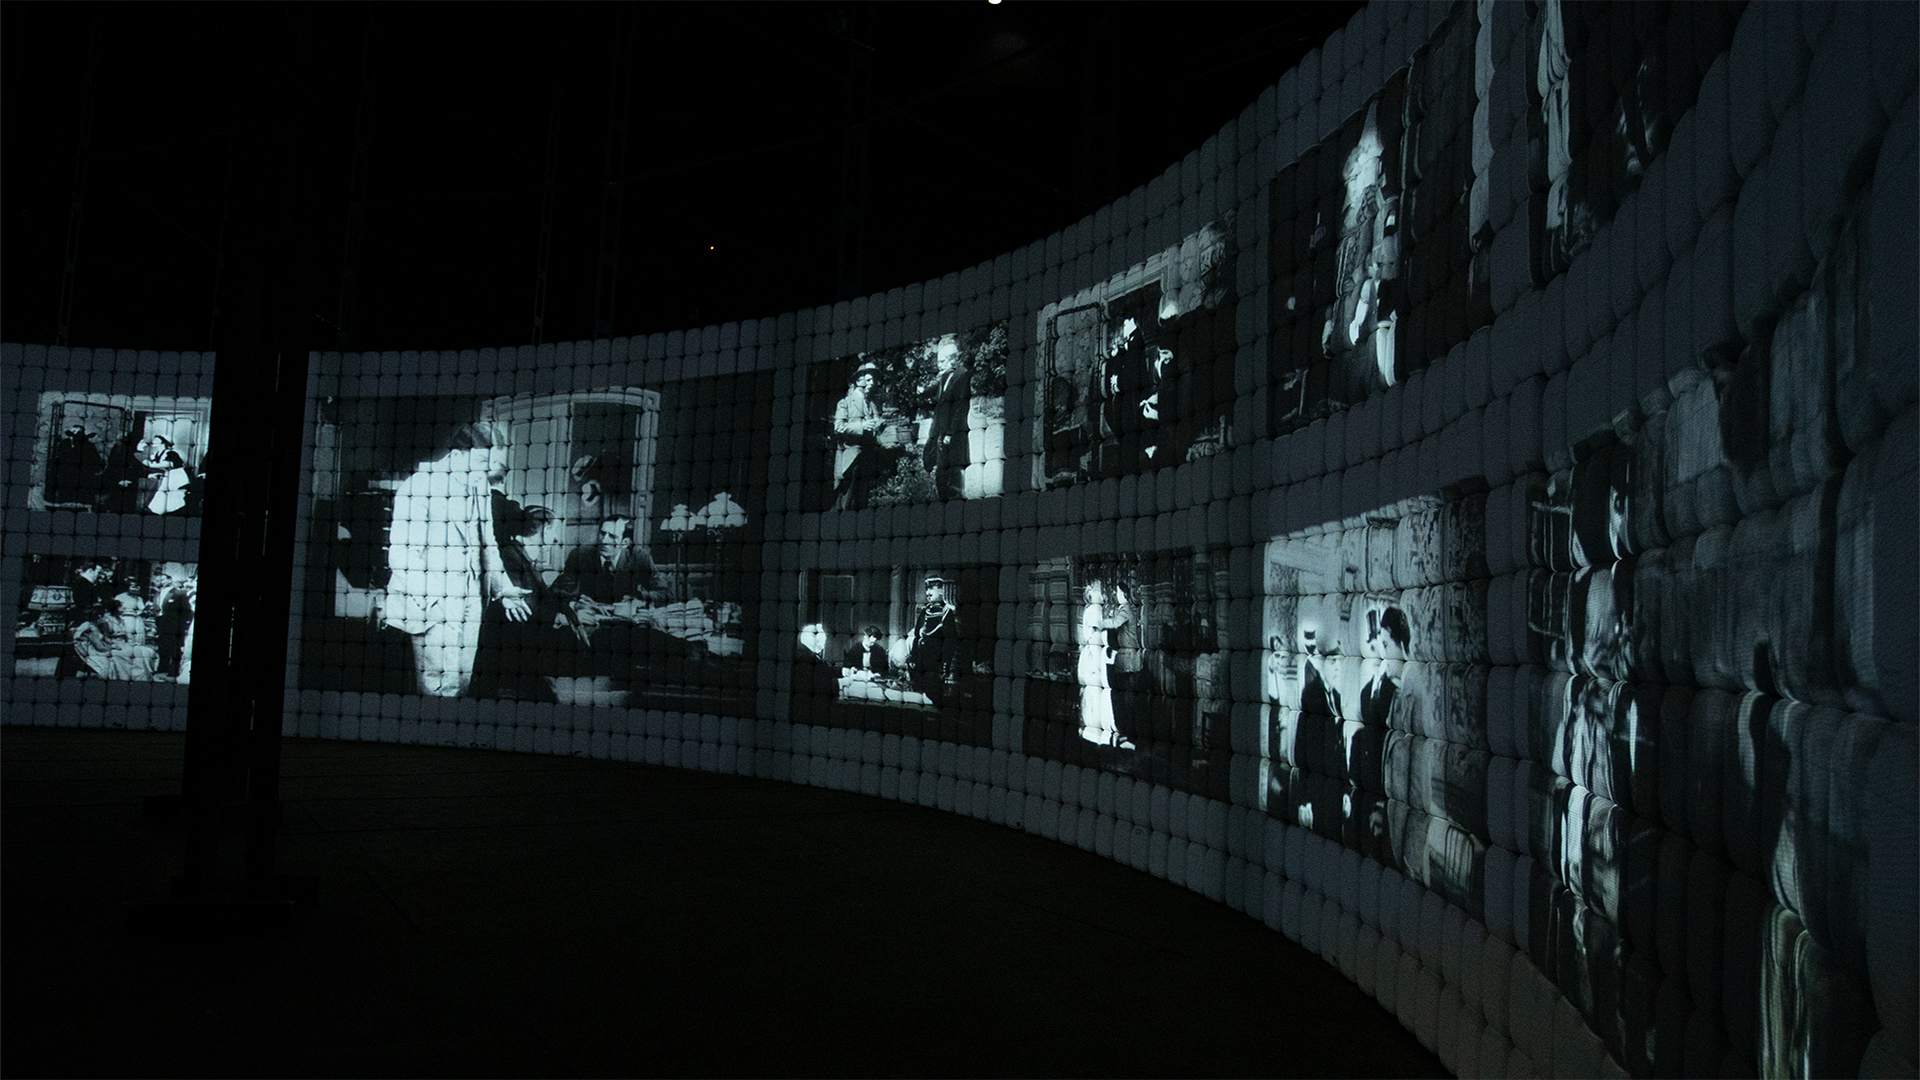
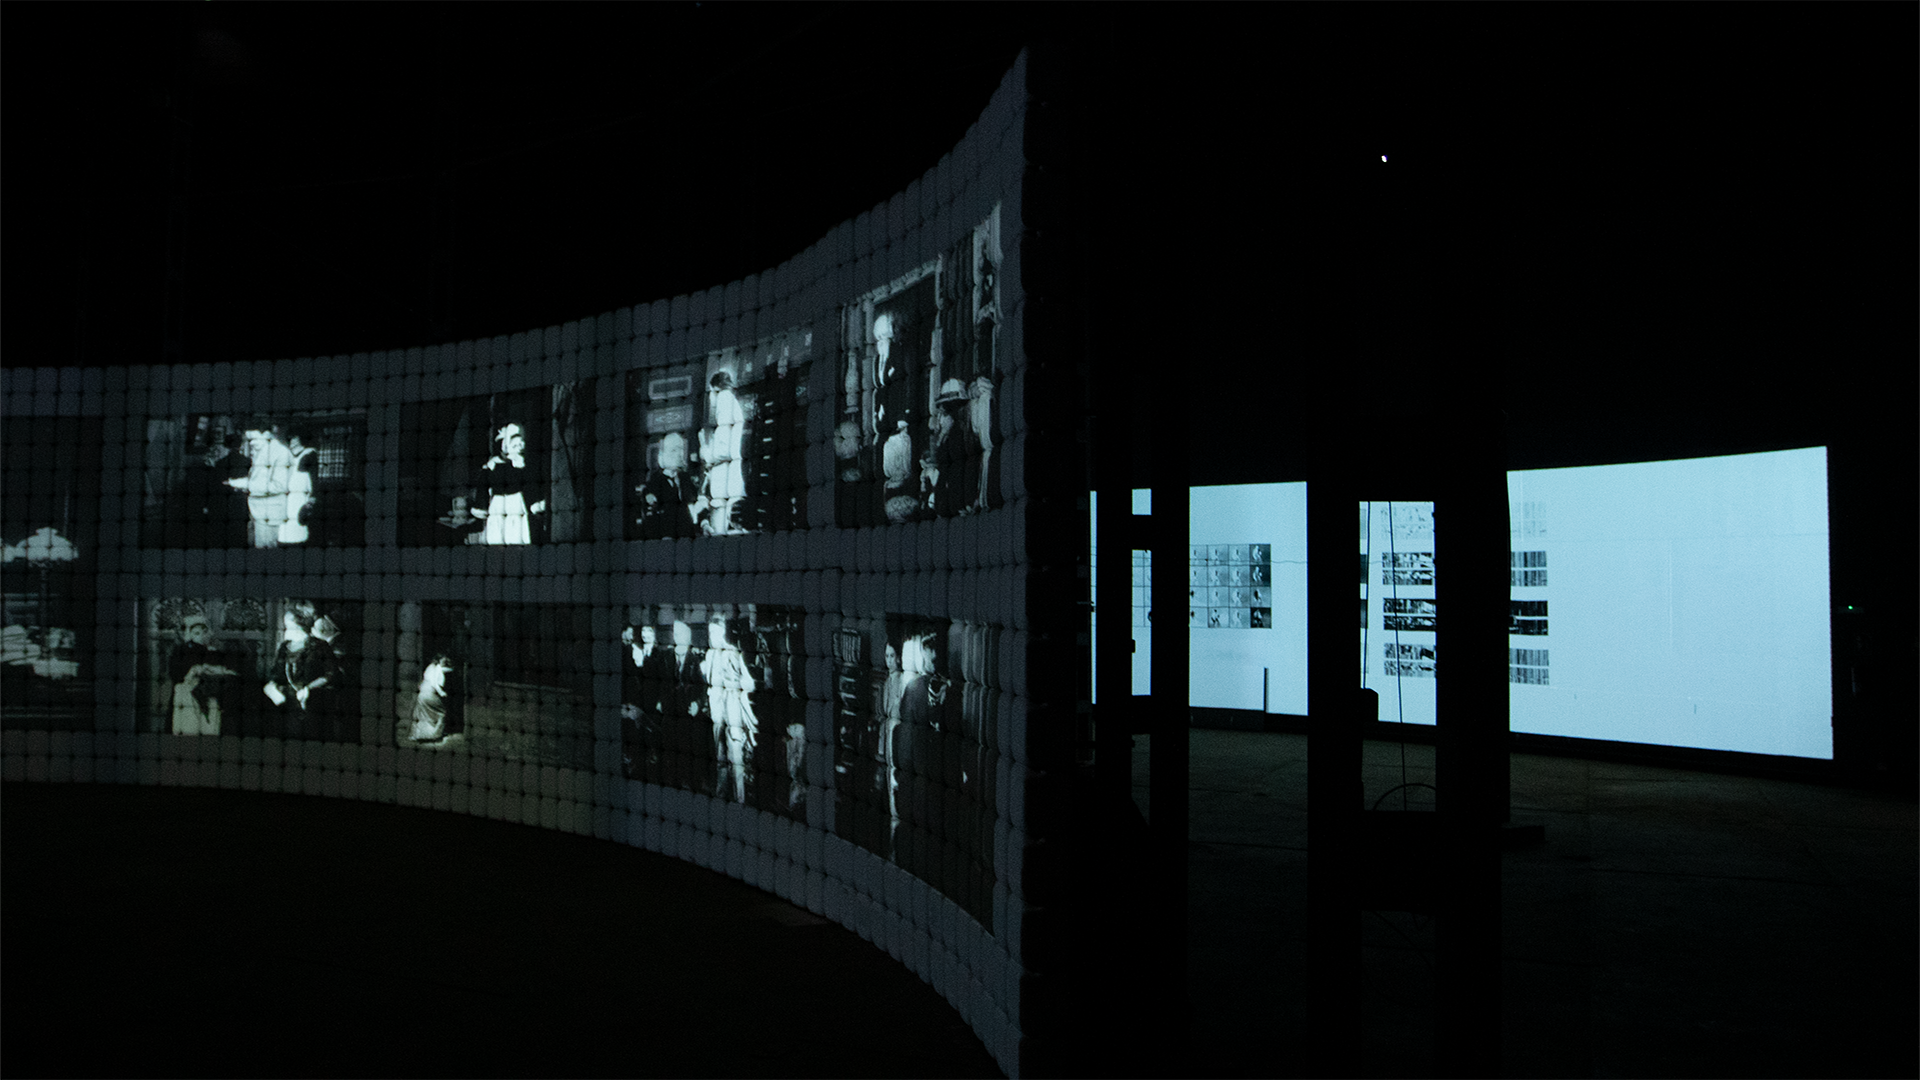
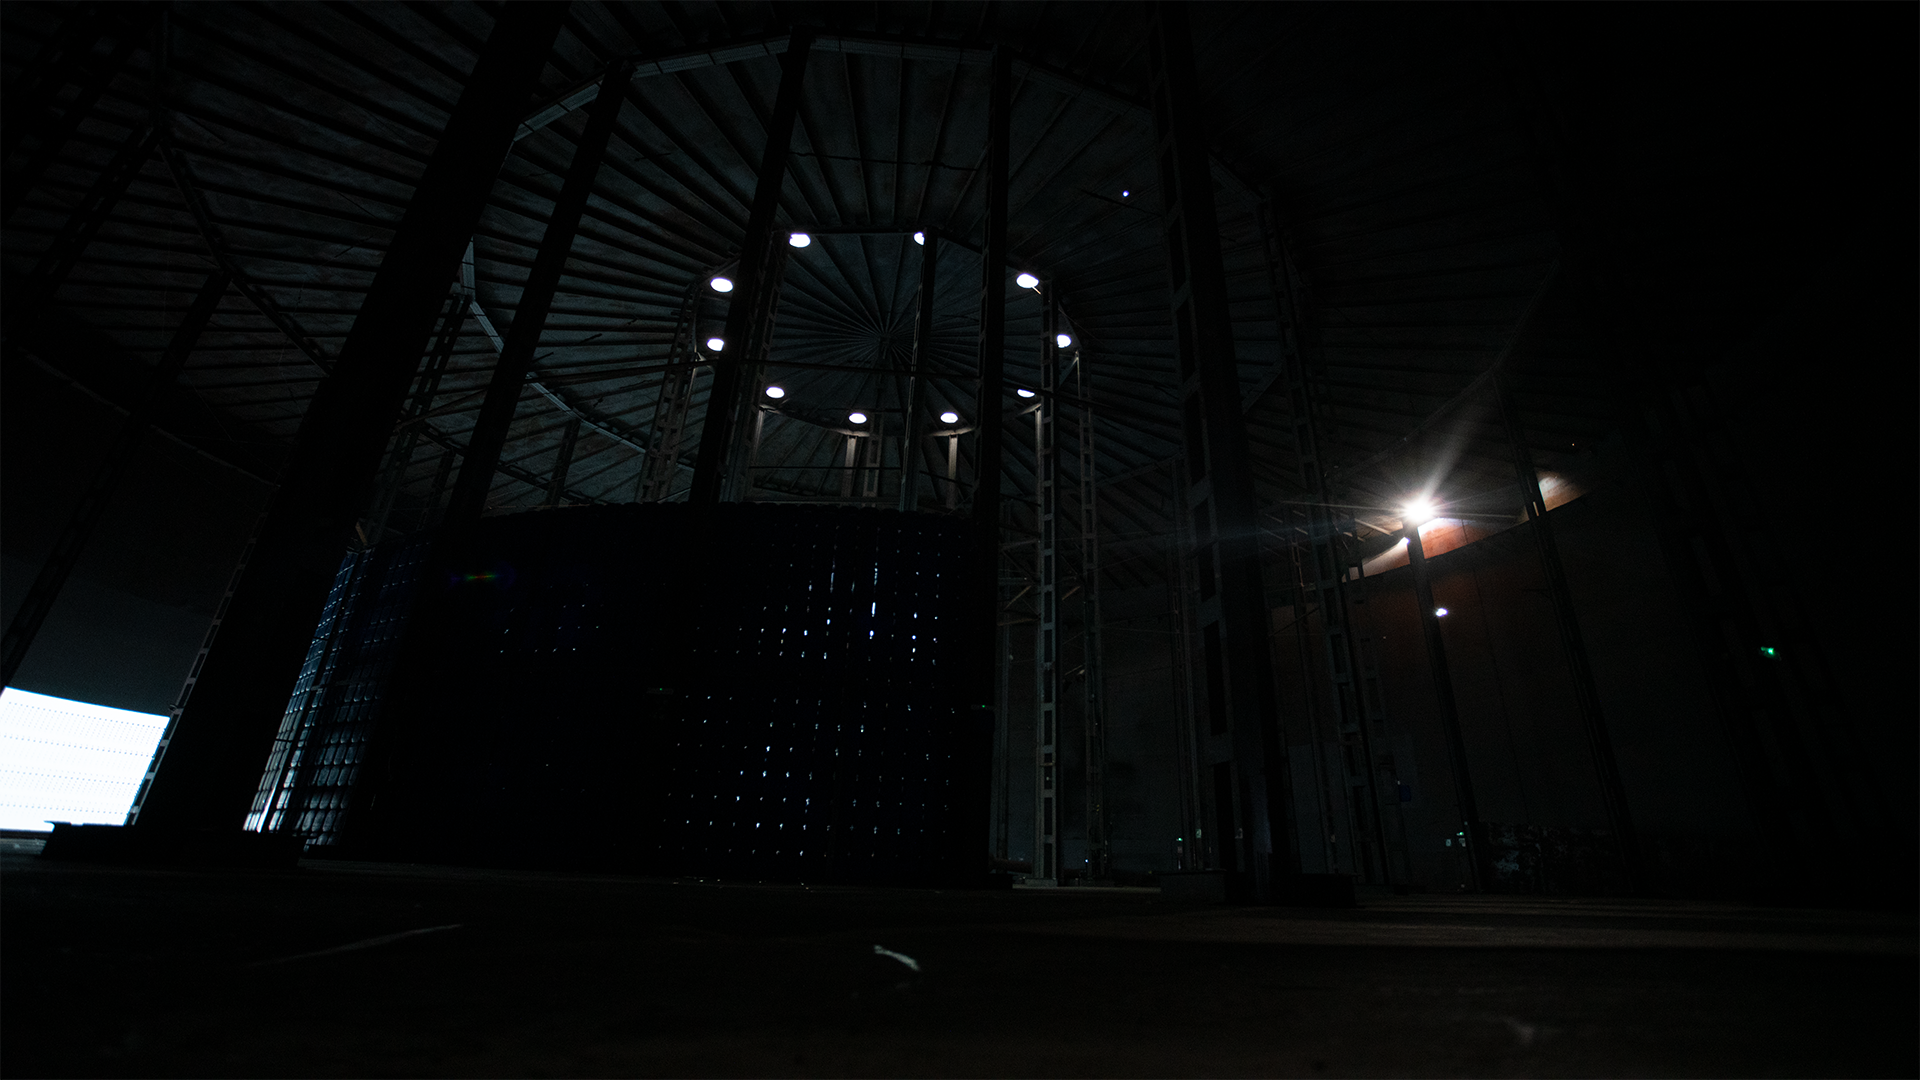
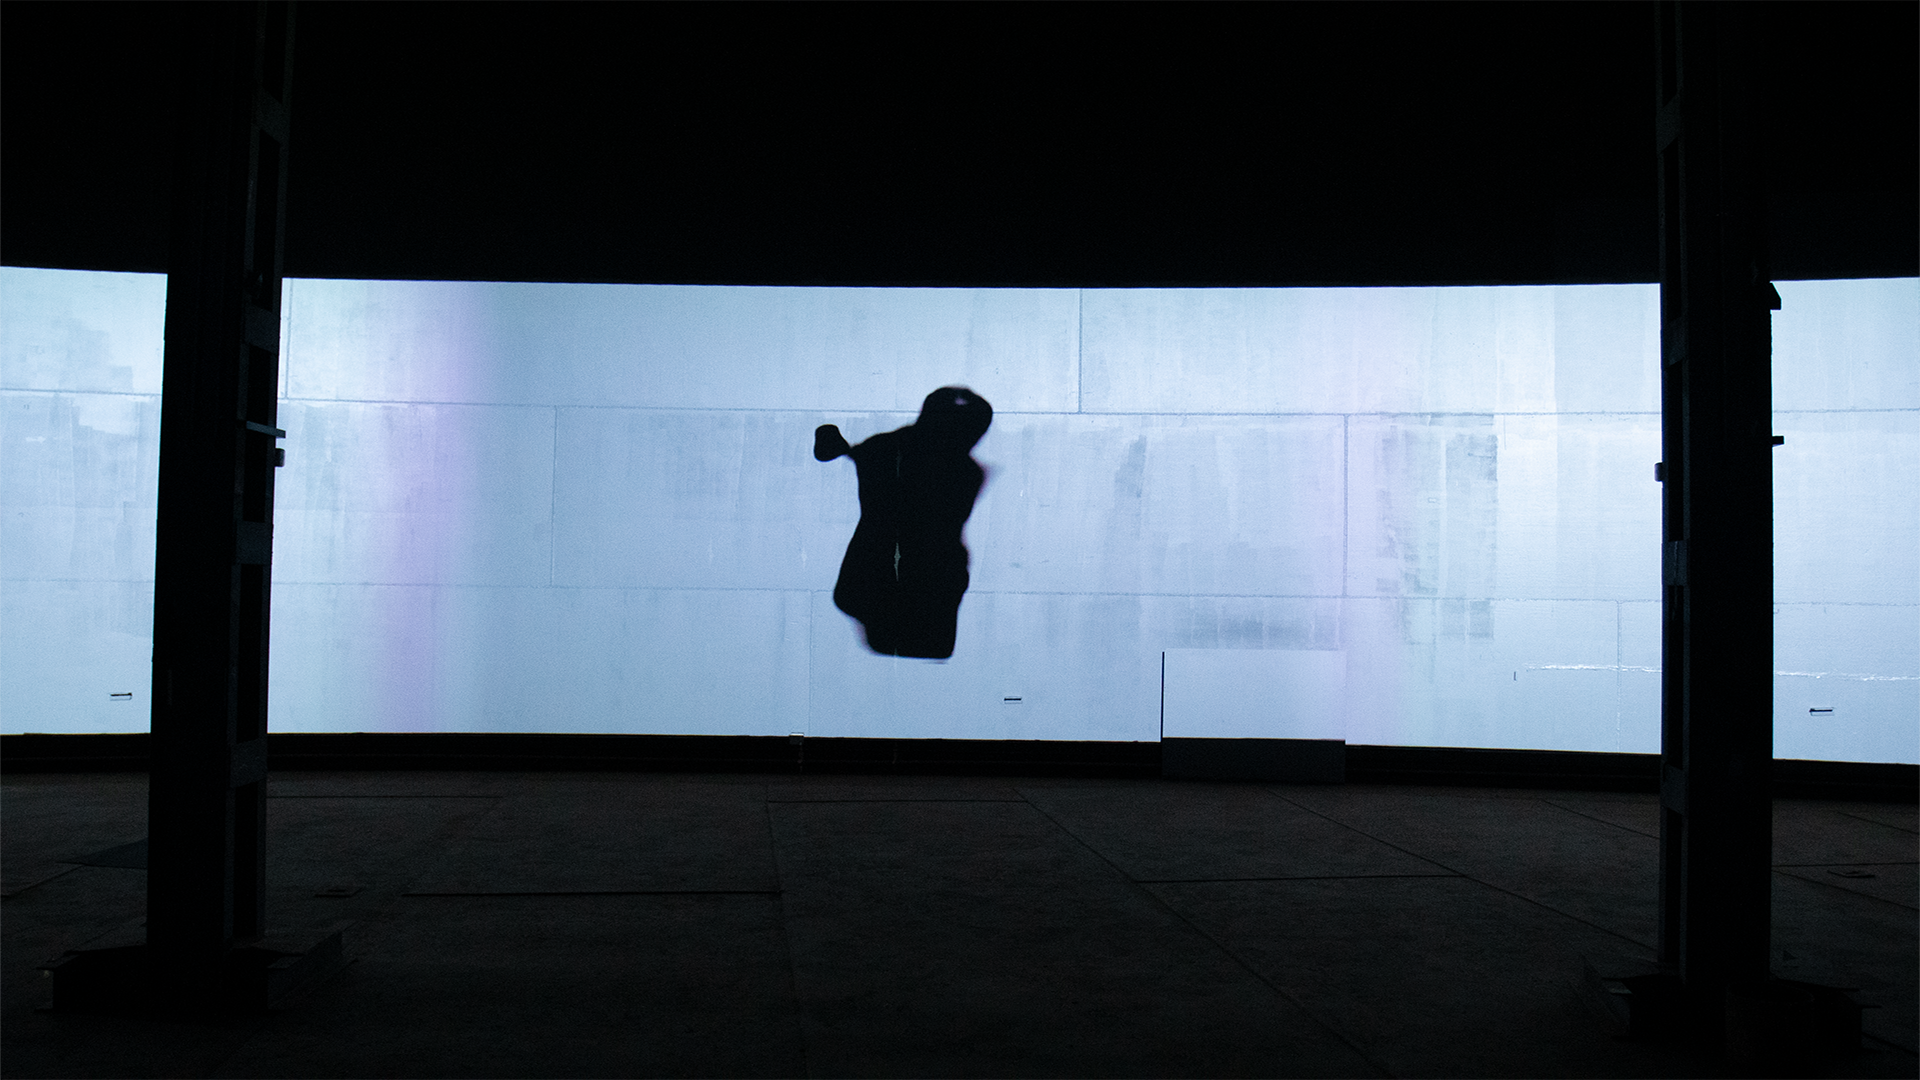
This spatial arrangement is adapted to the peculiar shape of the original exhibition space, the El Tanque Cultural Center in Tenerife.
The venue had curved walls and a curved screen made of water barrels.
The demo video is shown on a monitor by the main entrance, to introduce visitors to the idea of the exhibition.
VIDEO PRESENTATION
ALGORITHM
The first step is the selection of a set of moving image sequences. In this case, the moving images are from two films directed by Louis Feuillade, Les Vampires and Judex.
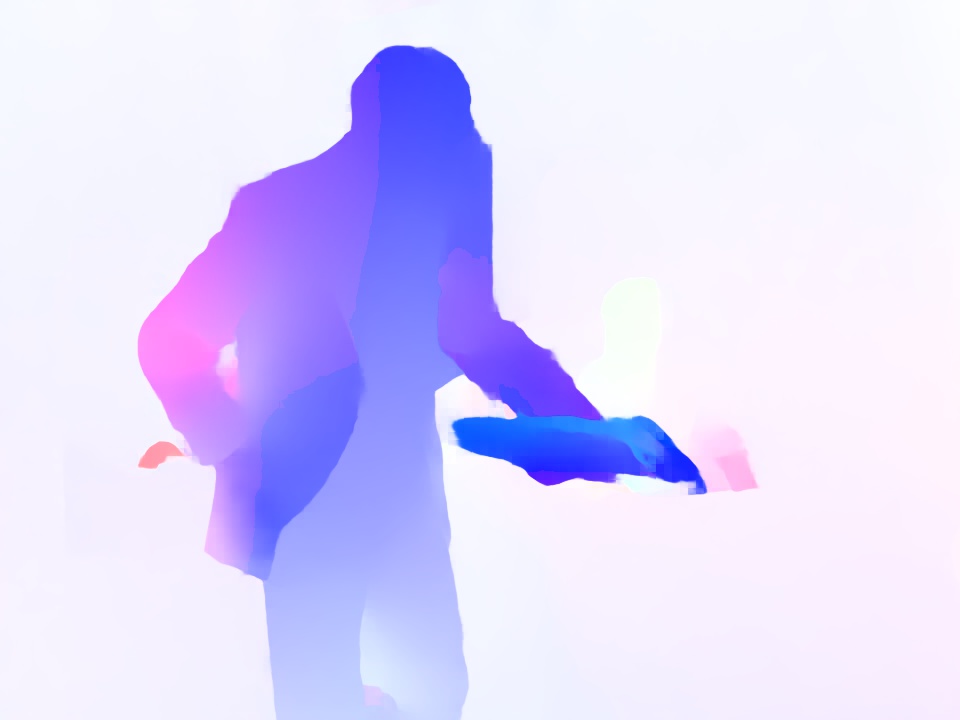
We then use a deep neural network to estimate a dense optical flow field for every pair of successive images in each sequence. We use the RAFT method of Teed and Deng(1). Every flow field is converted into an HSV color image, where the color of each pixel is a function of the flow vector at that pixel. The Saturation at each pixel is held constant at the maximum possible value, the Hue is a function of the orientation of the flow vector at that pixel, and the Value is a function of the magnitude of the vector (the greater the magnitude, the darker the pixel). The images are then converted to an RGB color space to be processed by the neural network in the next step.
We then apply the VGG-19 network, pretrained on ImageNet, to each optical flow image, to extract the 256 feature maps from the layer known as block 3 conv 1. We construct a 256 x 256 Gram matrix using these feature maps in the manner of the neural style transfer algorithm(2).
The next step is to flatten each Gram matrix into a feature vector with 65,536 components. To reduce the dimensionality of the vectors, we first train a PCA model of dimensionality 512 on the features of a subset of the dataset, using the Incremental PCA implementation in the Scikit-learn library. We then project every feature vector onto this model, so that every optical flow image is associated with a feature vector of 512 components.
To determine the similarity between any pair of images, we compute the correlation distance between their feature vectors. We use the implementation of this metric in the SciPy library(3). We found by inspection that this measure provided perceptually more convincing matches than the Euclidean distance.
To compare any pair of scenes, we sum the correlation distances between the feature vectors of their corresponding frames.
The central sequence is divided into consecutive 15-frame segments. For each segment in the central sequence, the sixteen most similar scenes in other movies in the dataset are found. The similarity is measured using the correlation distance. These are shown to the left and right of the central sequence.
The images are slowed down (x16) using the method proposed by Huang, Zhang, Heng, Shi, and Zhou(4).
We also use another neural network to model visual attention, based on the method proposed by Ting Zhao and Xiangqian Wu in their CVPR 2019 paper "Pyramid Feature Attention Network for Saliency detection"(5). We apply this algorithm to the RAFT color images to obtain a saliency map. Here, we show one map where black represents maximum saliency.
We use this method to produce chapter one of the video in the second component of the installation. We also apply each saliency map as a mask to the corresponding original movie frame to darken the parts that lack saliency and brighten those that are most salient.
VISUALIZATION
The installation’s second component consists of three synchronized video channels, which reveal how one of the neural networks used in the production of this work analyzes the central sequence from Les Vampires.
This video has three chapters. The first visualizes the areas of the image where the neural network has detected movement (rendered in black).
The second chapter shows how the neural network analyses motion.
The structure of the neural network used in this project consists of five layers, conventionally known as: block 1 conv 1, block 1 conv 2, block 2 conv 1, block 2 conv 2, and block 3 conv 1. The chapter has five sections, each visualizing one layer.
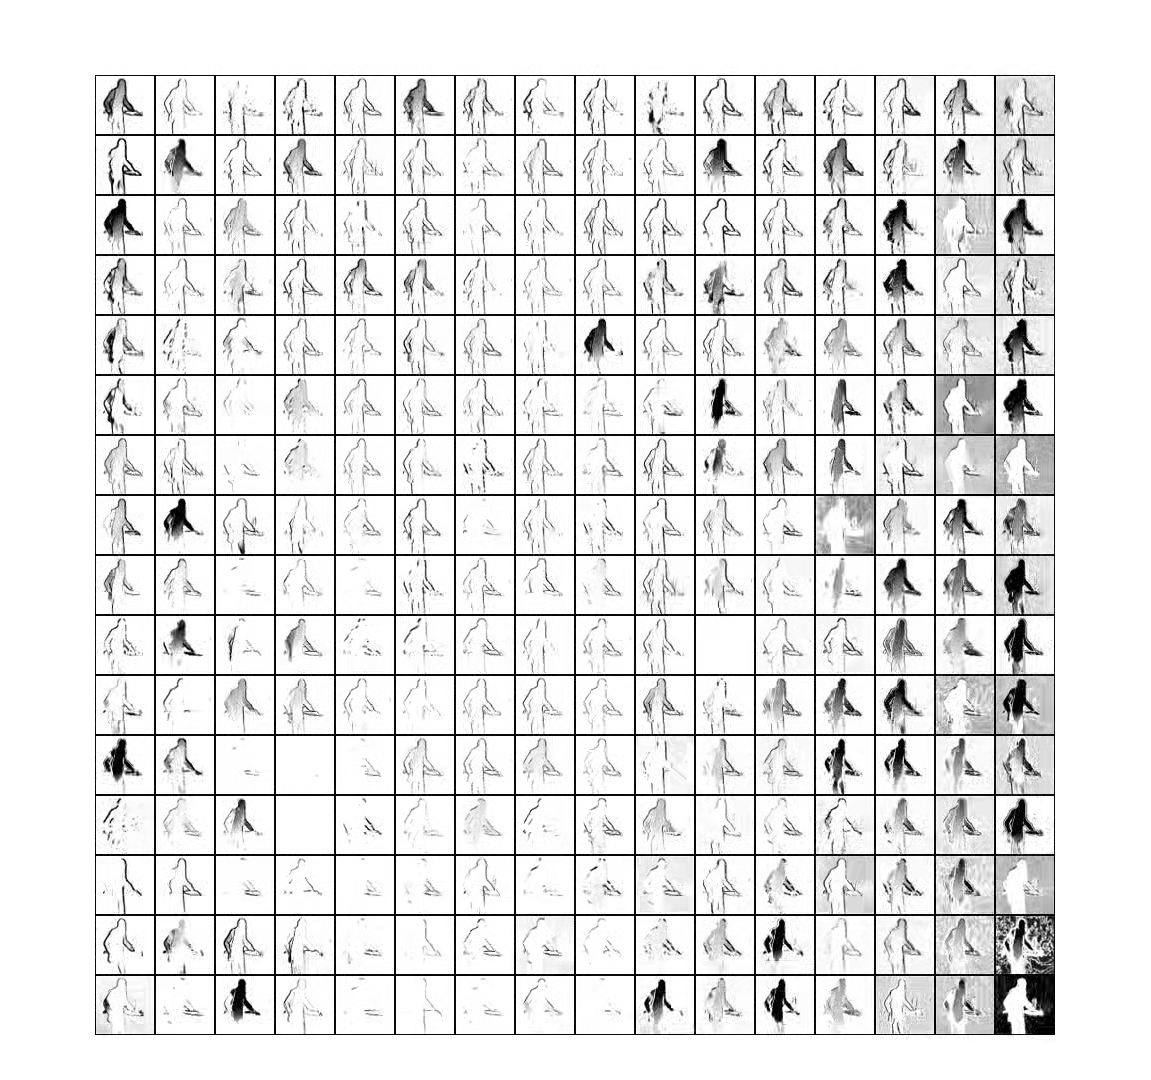
A network layer can be viewed as a system of filters that is applied to the outputs of the previous layer. Each filter has been trained to respond to the presence of specific features. The filters in each layer output a set of so-called “feature maps”. The feature maps for each layer are visualized as a grid of images in the central video channel.
Eight representative images are selected from each matrix using cluster analysis. This is done by applying the K-means clustering algorithm, as implemented in the Scikit-learn library, to the feature maps for the first frame in a sequence, requesting eight clusters, and then selecting the eight feature maps closest to each of the cluster centroids.
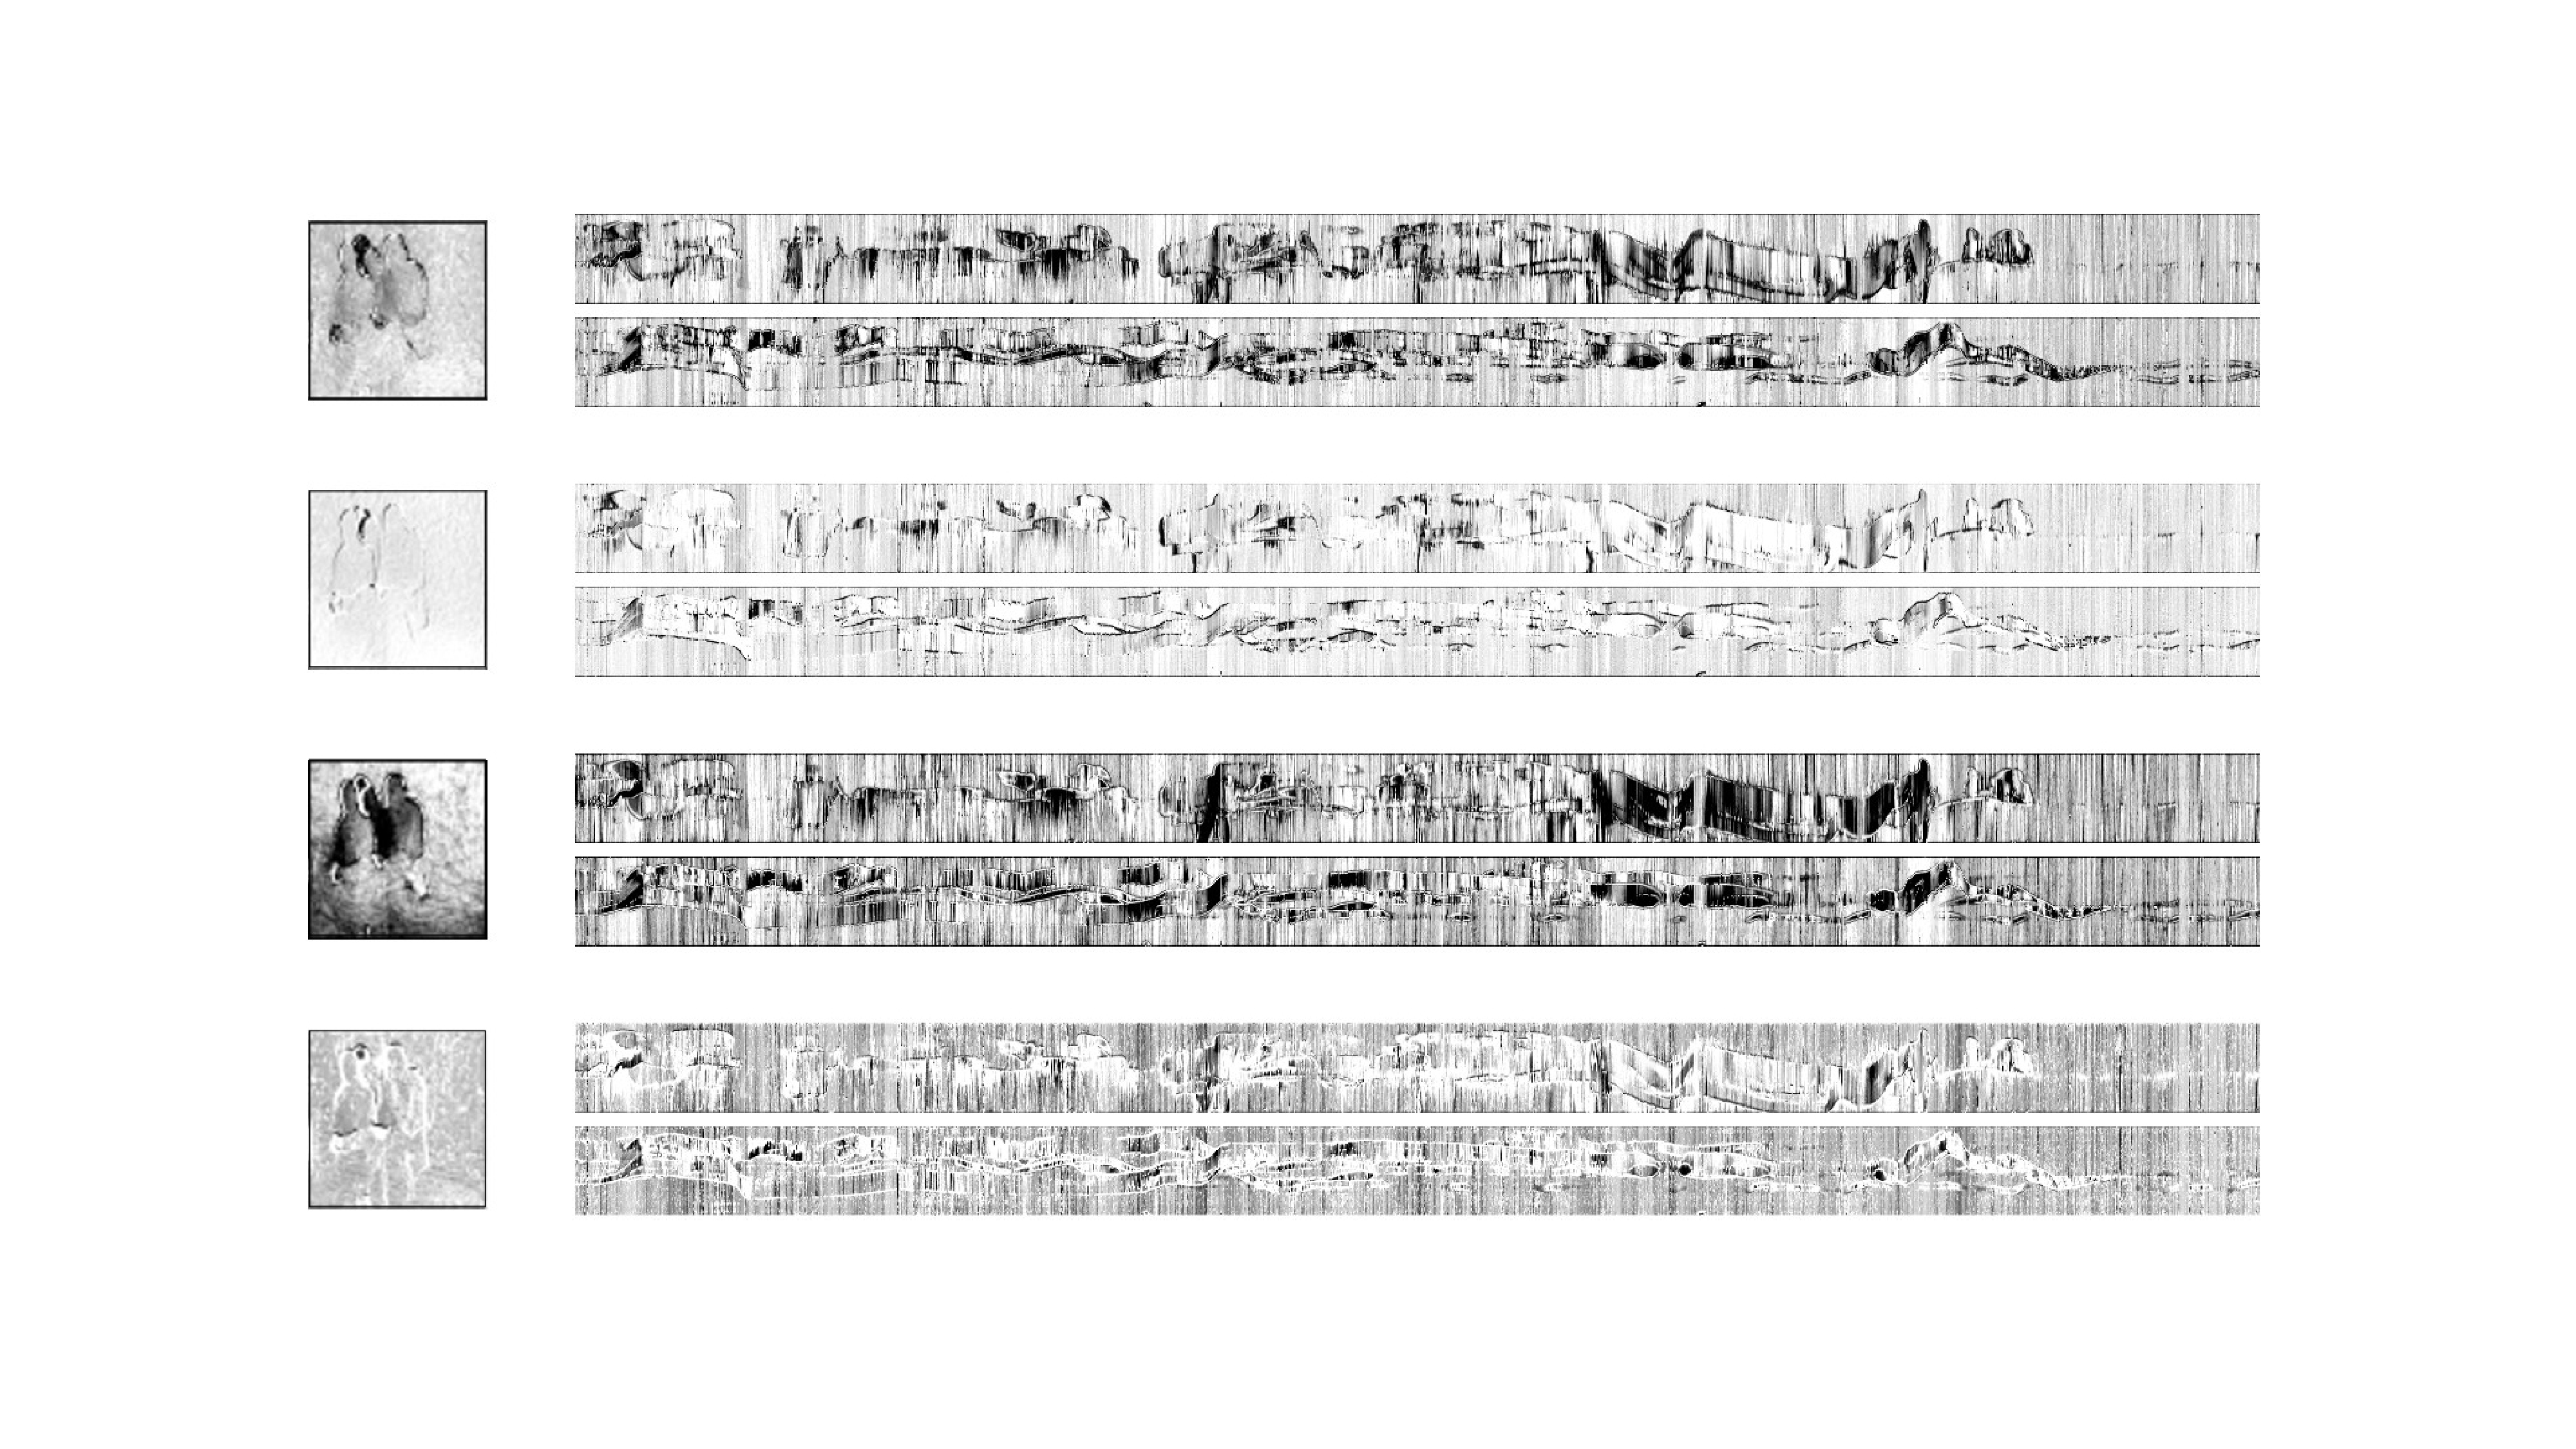
The temporal evolution of each of these feature maps is represented by two (horizontal and vertical) spatiotemporal sections.
These sections suggest musical scores extracted a posteriori from the moving images.
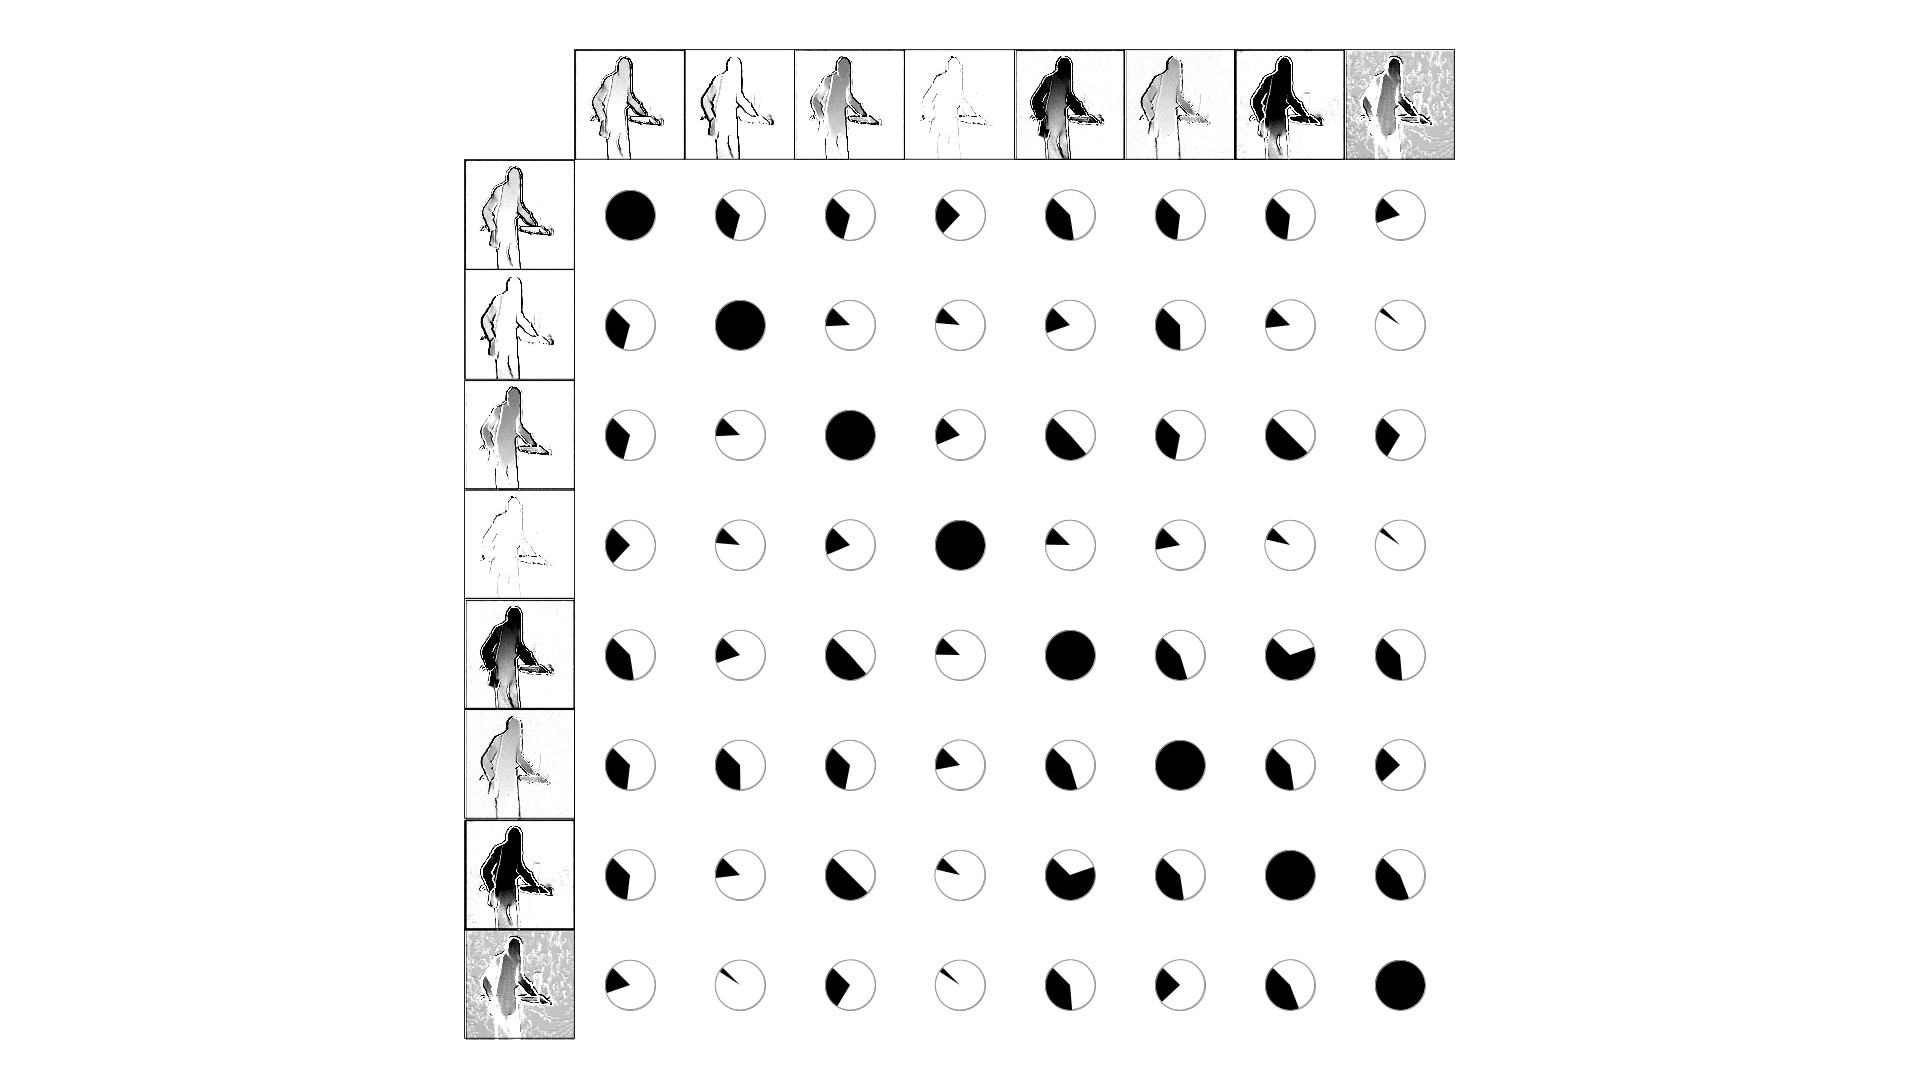
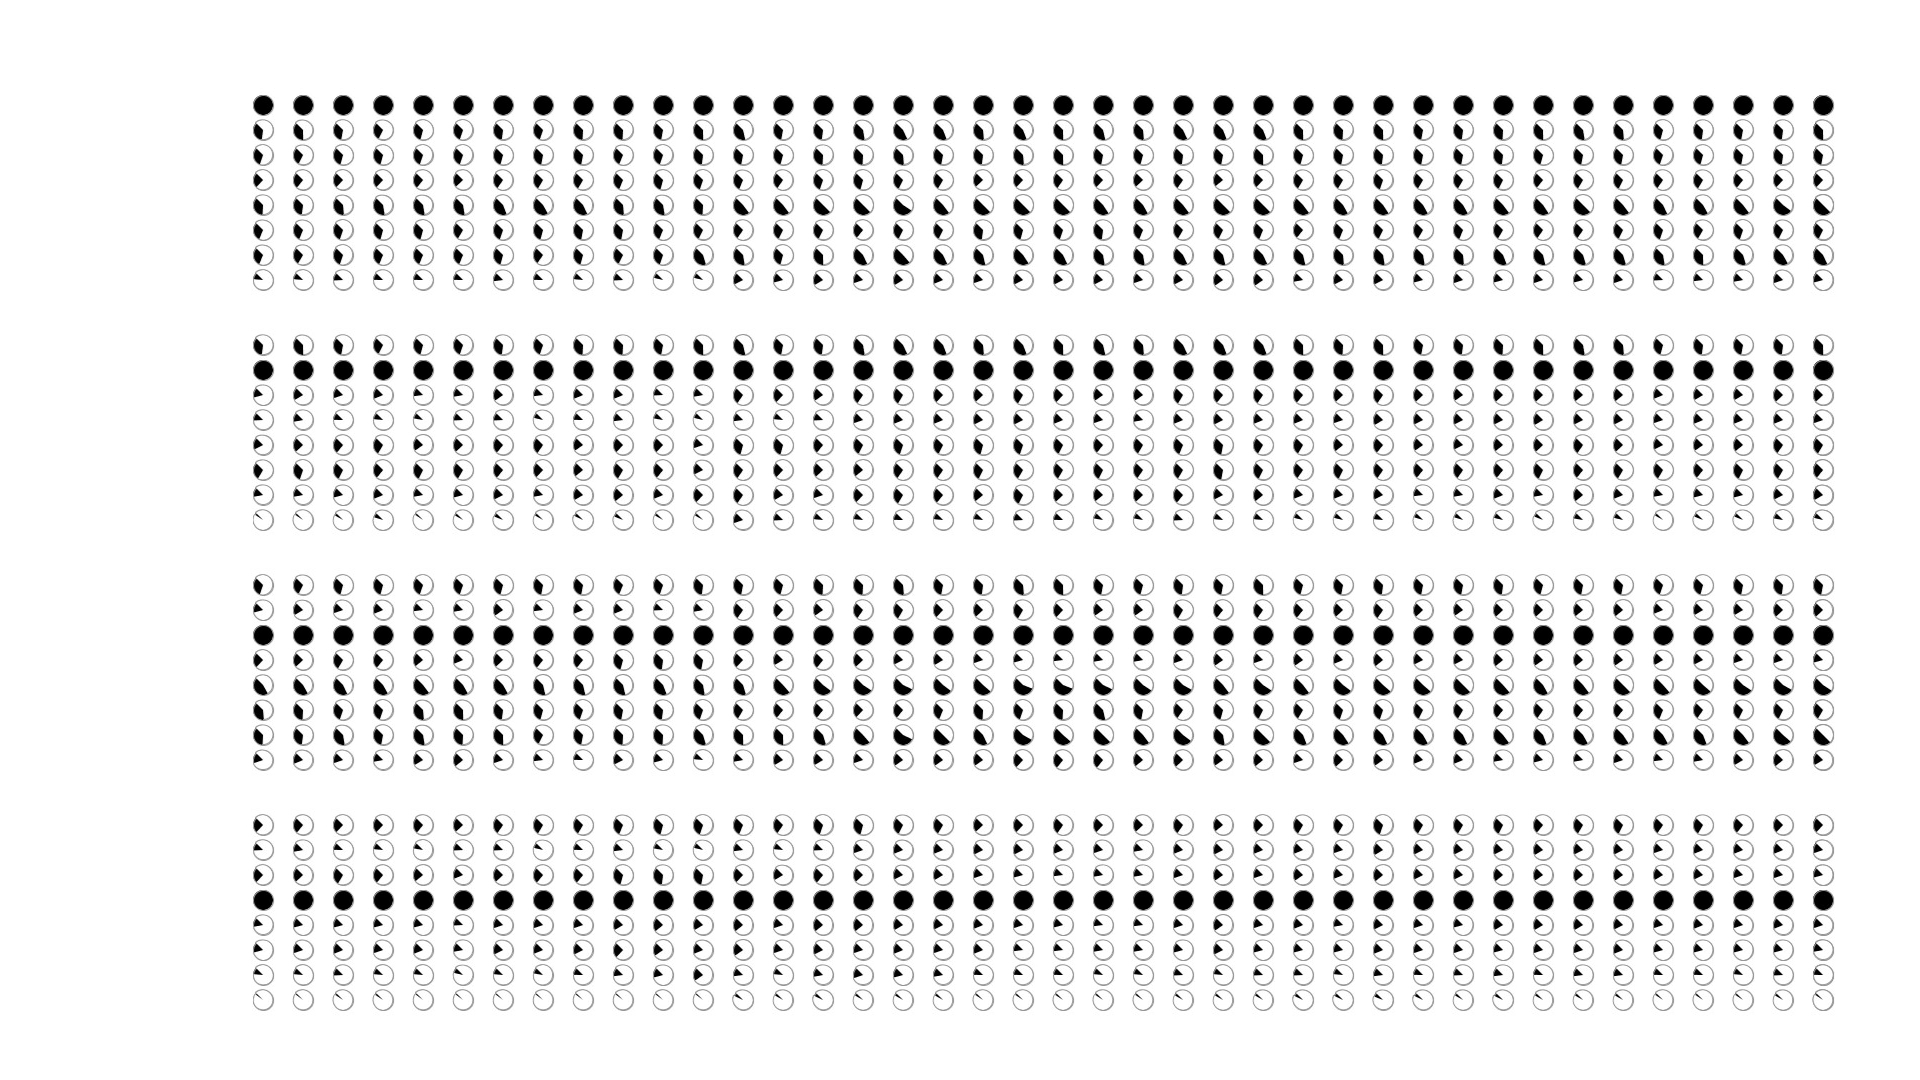
The last chapter uses circular glyphs to represent similarity relationships between feature maps. It aims to communicate a visual idea of the concept of a Gram matrix, or more broadly an affinity matrix, which is used internally by the algorithm to compare moving images. This visualization arranges the eight feature maps selected from the block 3 conv 1 layer into an eight-by-eight square matrix. The (i,j)th entry of the matrix is a circle, with a darkened sector. The size of the darkened sector is determined by the angle between the ith and jth feature maps. If the two feature maps are identical, the circle is entirely black. If they are very different, the circle is white or nearly white.
The network an affinity matrix to compare and select sequences from Feuillade and thus produce the first component of the installation. This last chapter thus makes manifest certain aspects of the constructive process that has made this installation possible.
To determine the dark area of the (i, j)th circle of the matrix, we compute the angle between the ith and jth feature maps. This method does not actually reproduce the underlying algorithm, which computes the dot product, rather than the angle, between all feature maps. But the angle between feature maps also conveys the notion of affinity or similarity, and it can be directly visualized by drawing a circle with a darkened sector whose angle is the same as the angle between the corresponding feature maps.
These changing circles provide an alternative visualization of the temporal rhythm of cinematic sequences.
Centre for Applied Computing and Interactive Media,
City University of Hong Kong
This work was premiered on July 3, 2021
at the El Tanque Cultural Center in Tenerife, Spain.