TECHNICAL WORKFLOW
This page gives a more detailed description of the algorithm used. The procedure involves two main stages: analysis and comparison.
ANALYSIS
Given a film consisting of N frames, apply the following procedure to frames from 1 to N-1.
1. Normalize the frame (subtract from the value of each pixel the mean value and divide the
result by the standard deviation) to minimize the effect of unstable brightness due to aged footage.
2. Segment each frame into rectangular blocks of pixels (“flowpoints”).
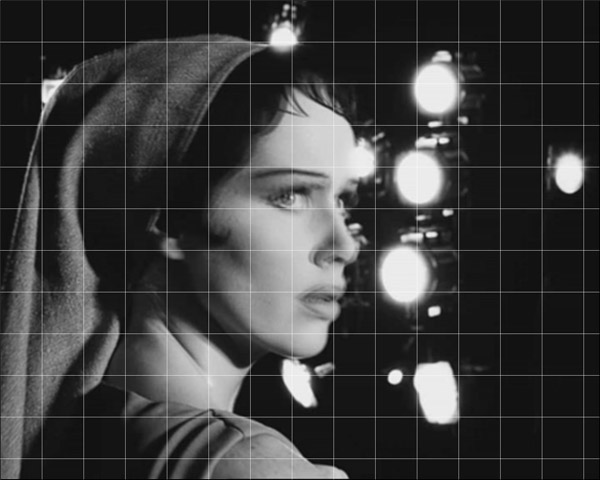
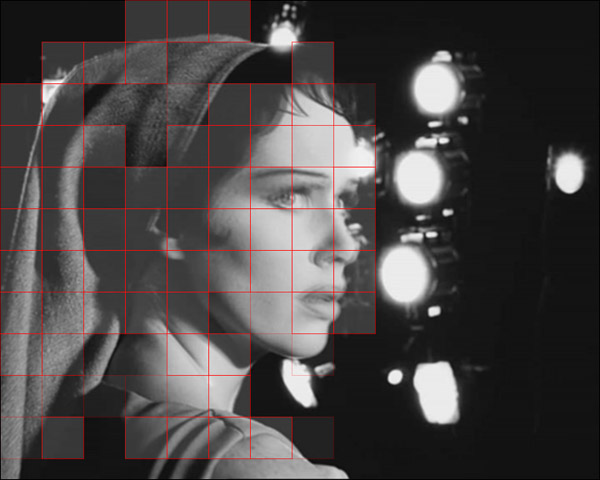
3. Apply frame differencing to identify those flowpoints where no significant motion occurs.

4. Track only the remaining flowpoints from this frame to the next frame.
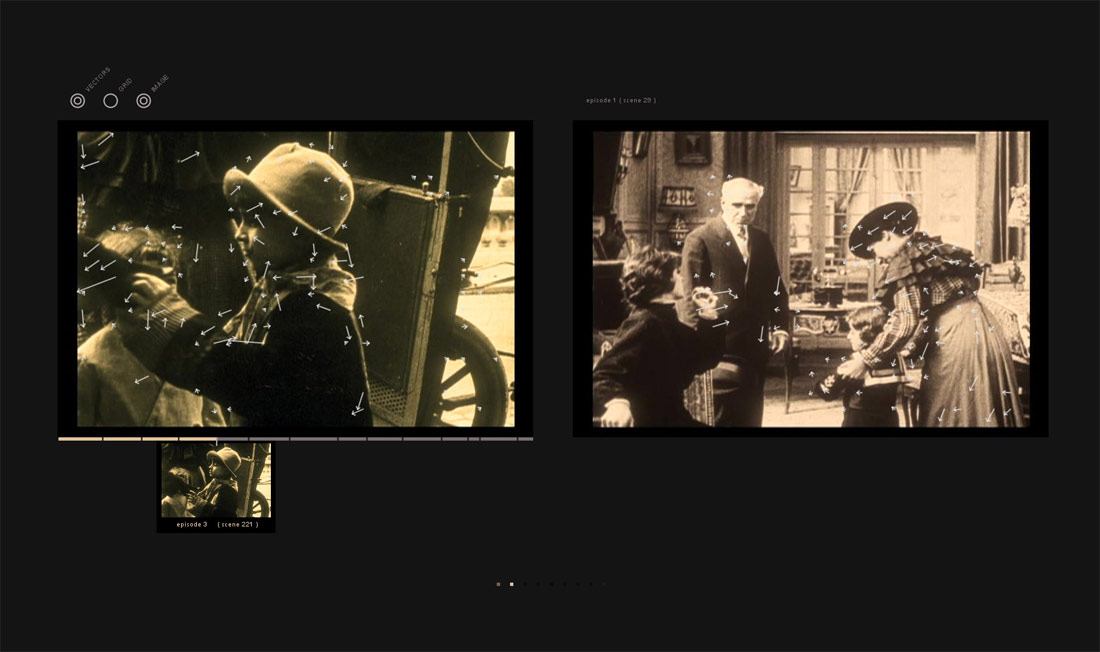
5. Compute the vector field that represents the hypothesized motion between the current frame and the next frame.
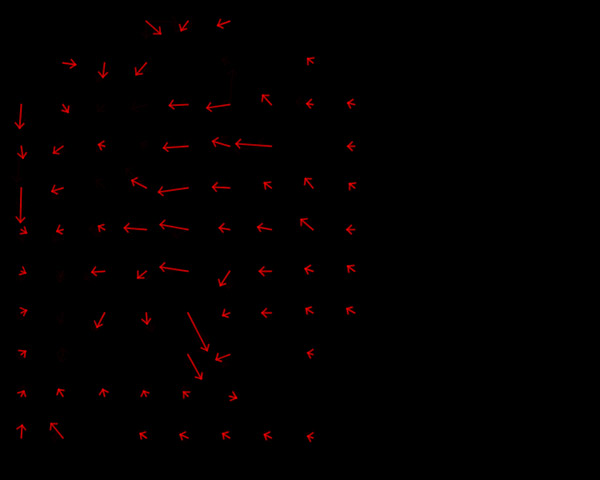
6. Locate any spurious motion due to jittery quality of old footage by tracking a larger flowpoint and subtracting the resulting vectors from the previously obtained vector field.
7. Quantize the optical flow data into bins that represent the speed and orientation and arrange the data into a flow histogram.
8. Compute the covariance matrix of all histograms in the current sequence, then apply the statistical technique known as Principal Component Analysis (PCA) and extract the principal components.
The movement of each frame in the movie will be represented by those principal components. These will be used as the basis for comparison in the next stage.
( The expression “movement of each frame” means the movement from one frame to the next frame in the sequence. )
COMPARISON
Assume a database of movie clips. Each frame transition is represented by the principal components obtained in the analysis stage. To compare different shots, repeat the following procedure.
1. Divide the movies in the archive into short segments of arbitrary length N. (In most cases, N = 10 frames).
2. For every N-frame segment X, perform the following operations:
2.1 Compute the Euclidean distance between the principal components of each frame in X and every sequence of N successive frames in the database. This distance measures the difference between the movements represented in each frame. The lower the distance, the closer the match.
2.2 After computing the distance between X and the rest of the database, select the N-frame sequence (call it Y) that most closely matches X.
2.3 Render X and Y side by side.
It is not necessary to select only the best match. It is possible to display, for instance, the 8 best matches instead of just one, since the algorithm effectively ranks pairs of shots in terms of the difference between the movements occurring in them. It is theoretically also possible to locate the worst matches and show them side by side.